Market Snapshot: Small Caps—When the Wild Ones Lead
Ever since the calendar flipped to the second half of 2025, small caps have performed well relative to their larger counterparts. The Russell 2000’s 14.7% total return through October month-end has outpaced the S&P 500’s 11.5%. However, this latest phase of outperformance has been extraordinarily narrow. Excluding biotech, only 30% of stocks in the Russell 2000 outperformed the index itself in Q3, the lowest breadth of outperformance since 1986. The top 50 stocks contributed nearly half of the quarter’s return, driven largely by industries such as biopharma, metals, crypto, and quantum computing.
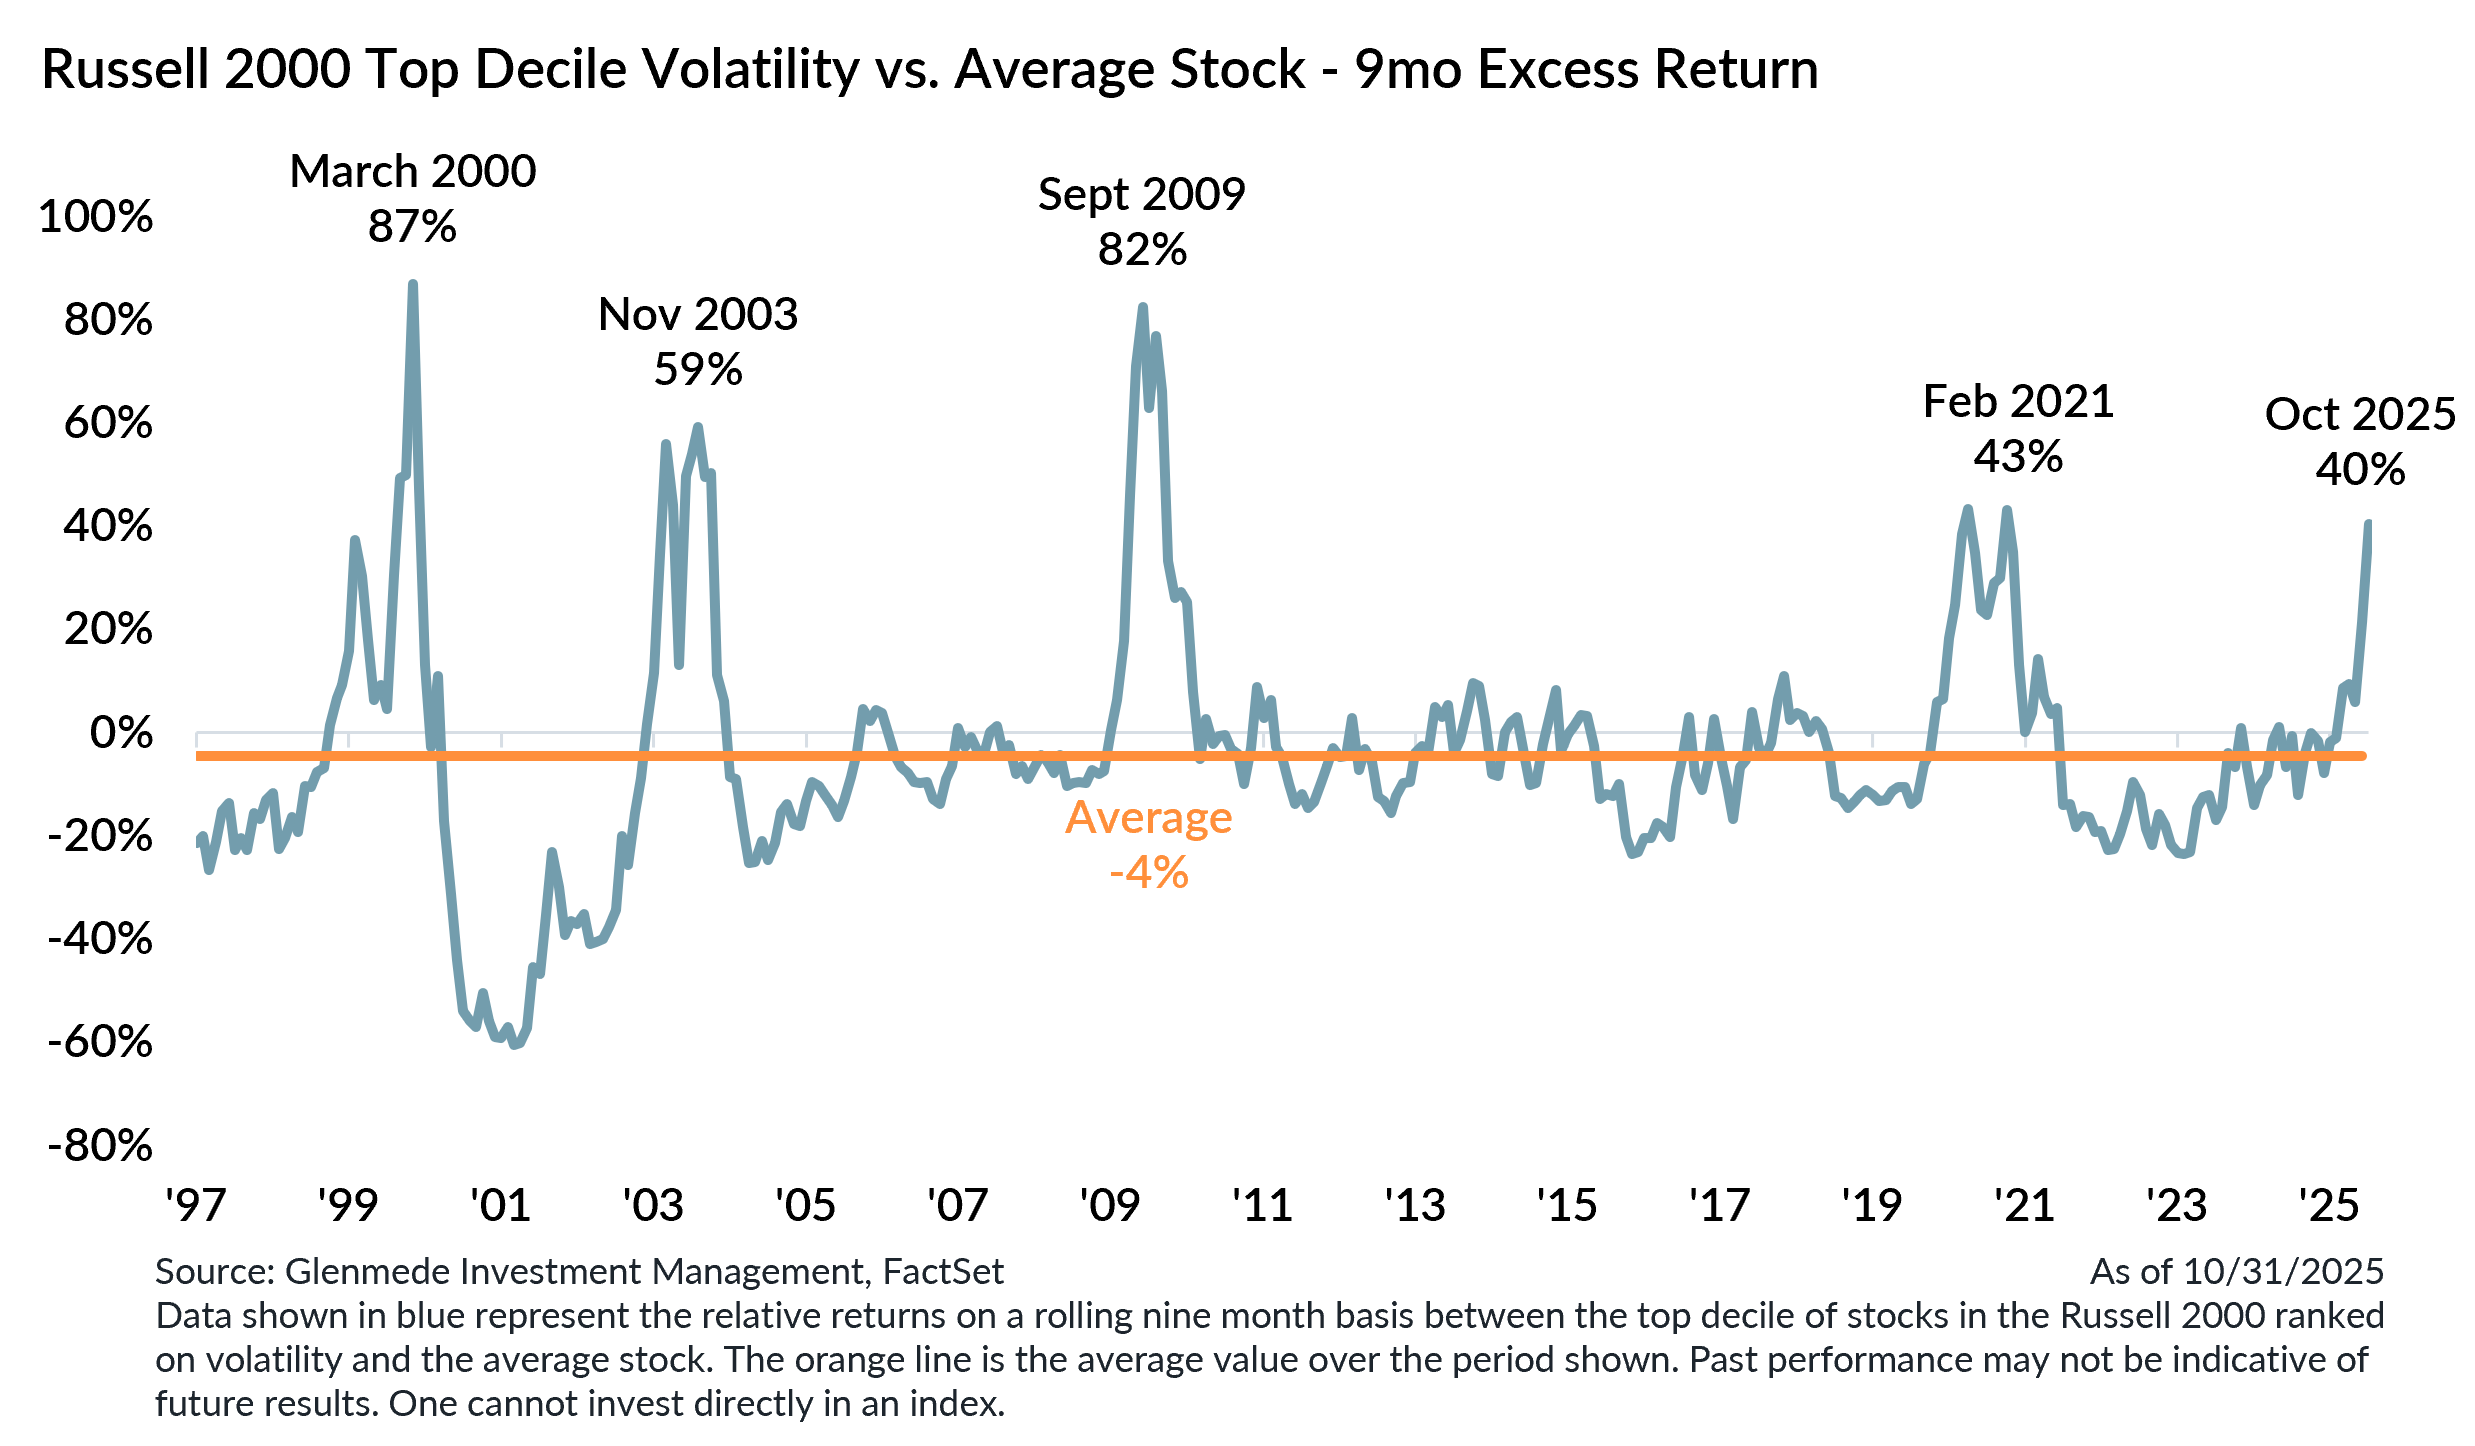
Another defining feature of this rally has been the outperformance of the most volatile companies in the small cap universe. On average, this cross section of companies has historically underperformed the average stock. Yet there have been periodic episodes when volatility has been rewarded, most notably during the last gasps of the Tech Bubble, the early-cycle rebounds following the 2001 and 2008 recessions, and the post-COVID “meme stock” surge.
These high-volatility leadership phases tend to emerge in late-cycle environments when speculative momentum peaks, but also during early-cycle recoveries as liquidity and confidence return to the market. The current moment, to some extent, exhibits characteristics of both. Investor risk appetite has been fueled by optimism surrounding artificial intelligence, while the U.S. economy appears to be rebounding from an uncertainty-driven soft patch amid meaningful monetary and fiscal stimulus.
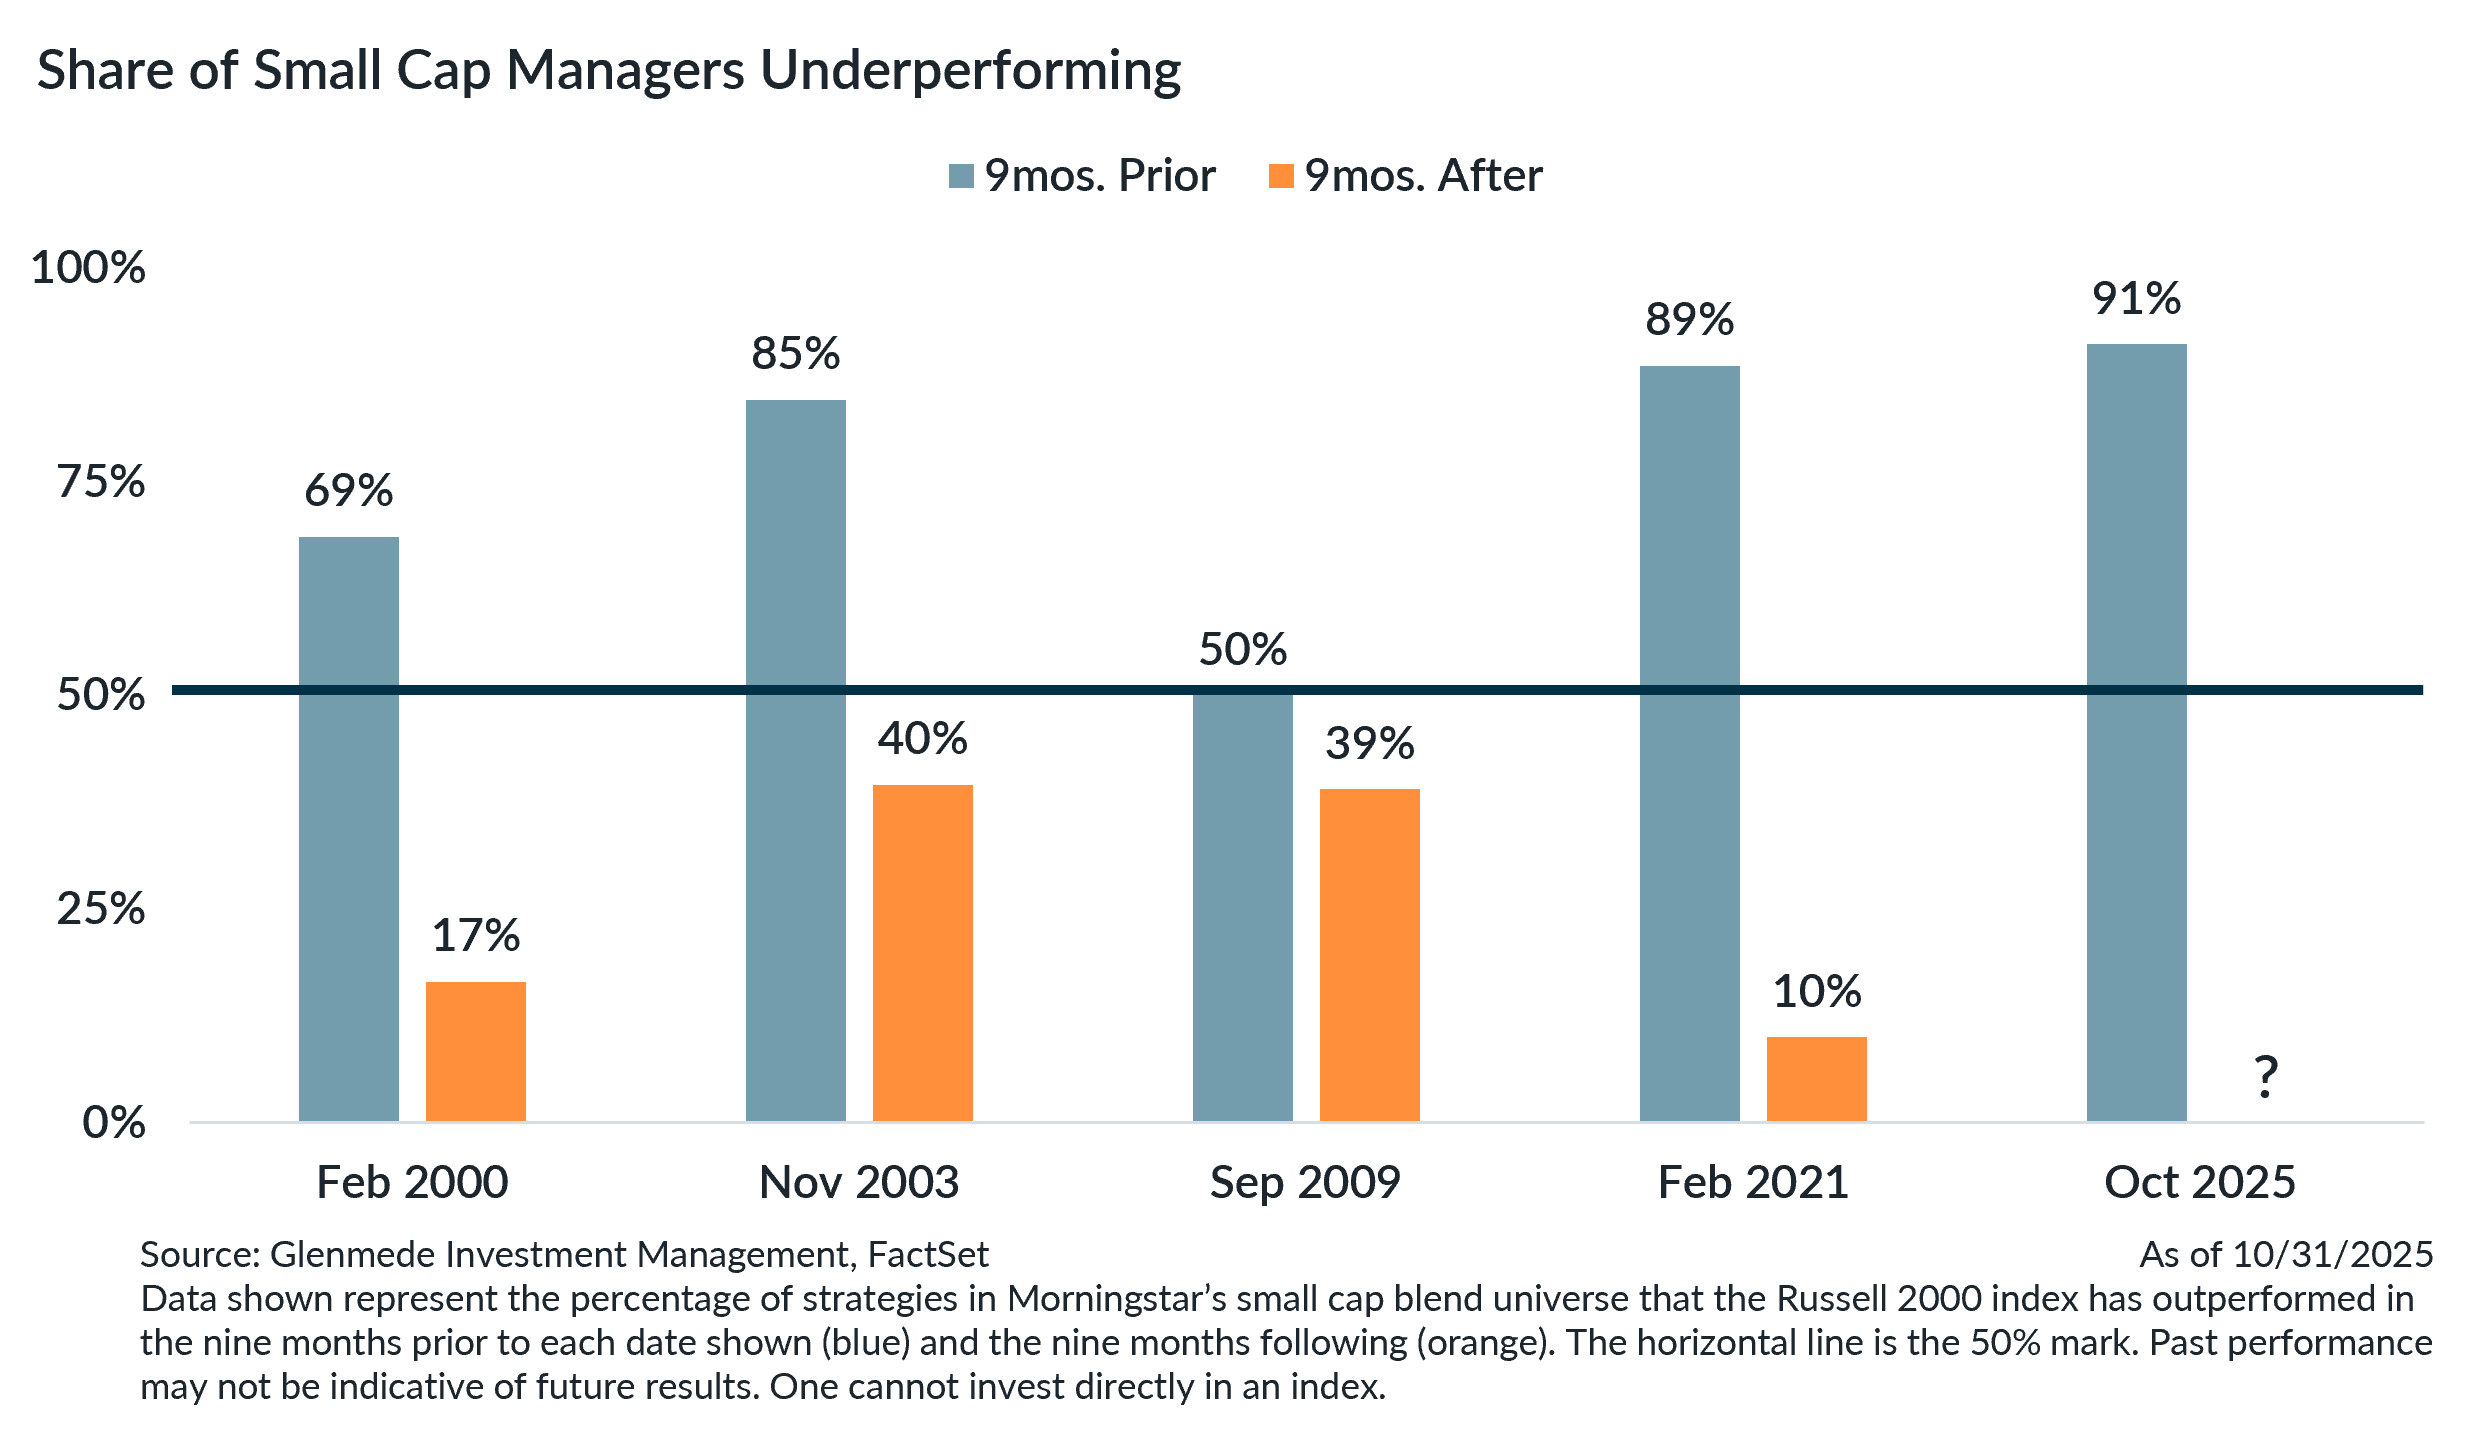
What should investors take away from this? Regardless of the drivers, periods of extreme high-volatility leadership within small caps have historically been followed by regime shifts that reward active selection. Small caps have long been a relatively inefficient asset class, where active management has been able to consistently add incremental value over time. For instance, the Russell 2000 index has outperformed only about one-third of Morningstar’s Small Cap Blend universe over the past 25 years. While the index has bucked that trend during volatility-driven rallies, subsequent periods have often proven more challenging for passive investors.
With volatility leadership reemerging in small caps, market dynamics are once again favoring selectivity. Historically, environments characterized by higher dispersion and shifting leadership have created fertile ground for active management. If these conditions persist, the months ahead may offer an important window of opportunity for skilled small cap stock pickers.
Jason Pride, CFA
Chief of Investment Strategy & Research
Glenmede
Michael Reynolds, CFA
Vice President, Investment Strategy
Glenmede
1 Data shown in blue represent the relative returns on a rolling nine-month basis between the top decile of stocks in the Russell 2000 ranked on volatility and the average stock. The orange line is the average value over the period shown. Past performance may not be indicative of future results. One cannot invest directly in an index.
2 Data shown represent the percentage of strategies in Morningstar’s small cap blend universe that the Russell 2000 index has outperformed in the nine months prior to each date shown (blue) and the nine months following (orange). The horizontal line is the 50% mark. Past performance may not be indicative of future results. One cannot invest directly in an index.
This material was produced by Glenmede Investment Management, LP or its affiliate The Glenmede Trust Company, N.A. (collectively, “Glenmede”) for informational purposes and is not intended as personalized investment advice to purchase, sell or hold any investment or pursue any particular strategy. Opinions and analysis expressed in this material are those of the author or investment team as of the date of preparation and may change without this document being updated. Views expressed do not necessarily reflect the opinions of all investment personnel at Glenmede and may not be reflected in all the strategies and products offered. Forecasts or estimates provided herein, including those related to market outlook are based on research including publicly available information, internally developed data and third-party sources believed to be reliable, but accuracy cannot be guaranteed. Future results may differ significantly depending on market, security specific, economic or political conditions. Charts and graphs provided herein are for illustrative purposes only. Past performance is no guarantee of future results. Indexes mentioned are unmanaged and do not include any expenses, fees or sales charges. It is not possible to invest directly in an index. Any index referred to herein is the intellectual property (including registered trademarks) of the applicable licensor. Any product based on an index is in no way sponsored, endorsed, sold or promoted by the applicable licensor and it shall not have any liability with respect thereto. Financial intermediaries are only permitted to distribute this material in accordance with applicable law and regulation. Such financial intermediaries are required to satisfy themselves that the information in this material is appropriate for any person to whom they provide it. Glenmede shall not be liable for the use or misuse of this material by any such financial intermediary.