Beyond the AI Spending Boom: Value in International Markets
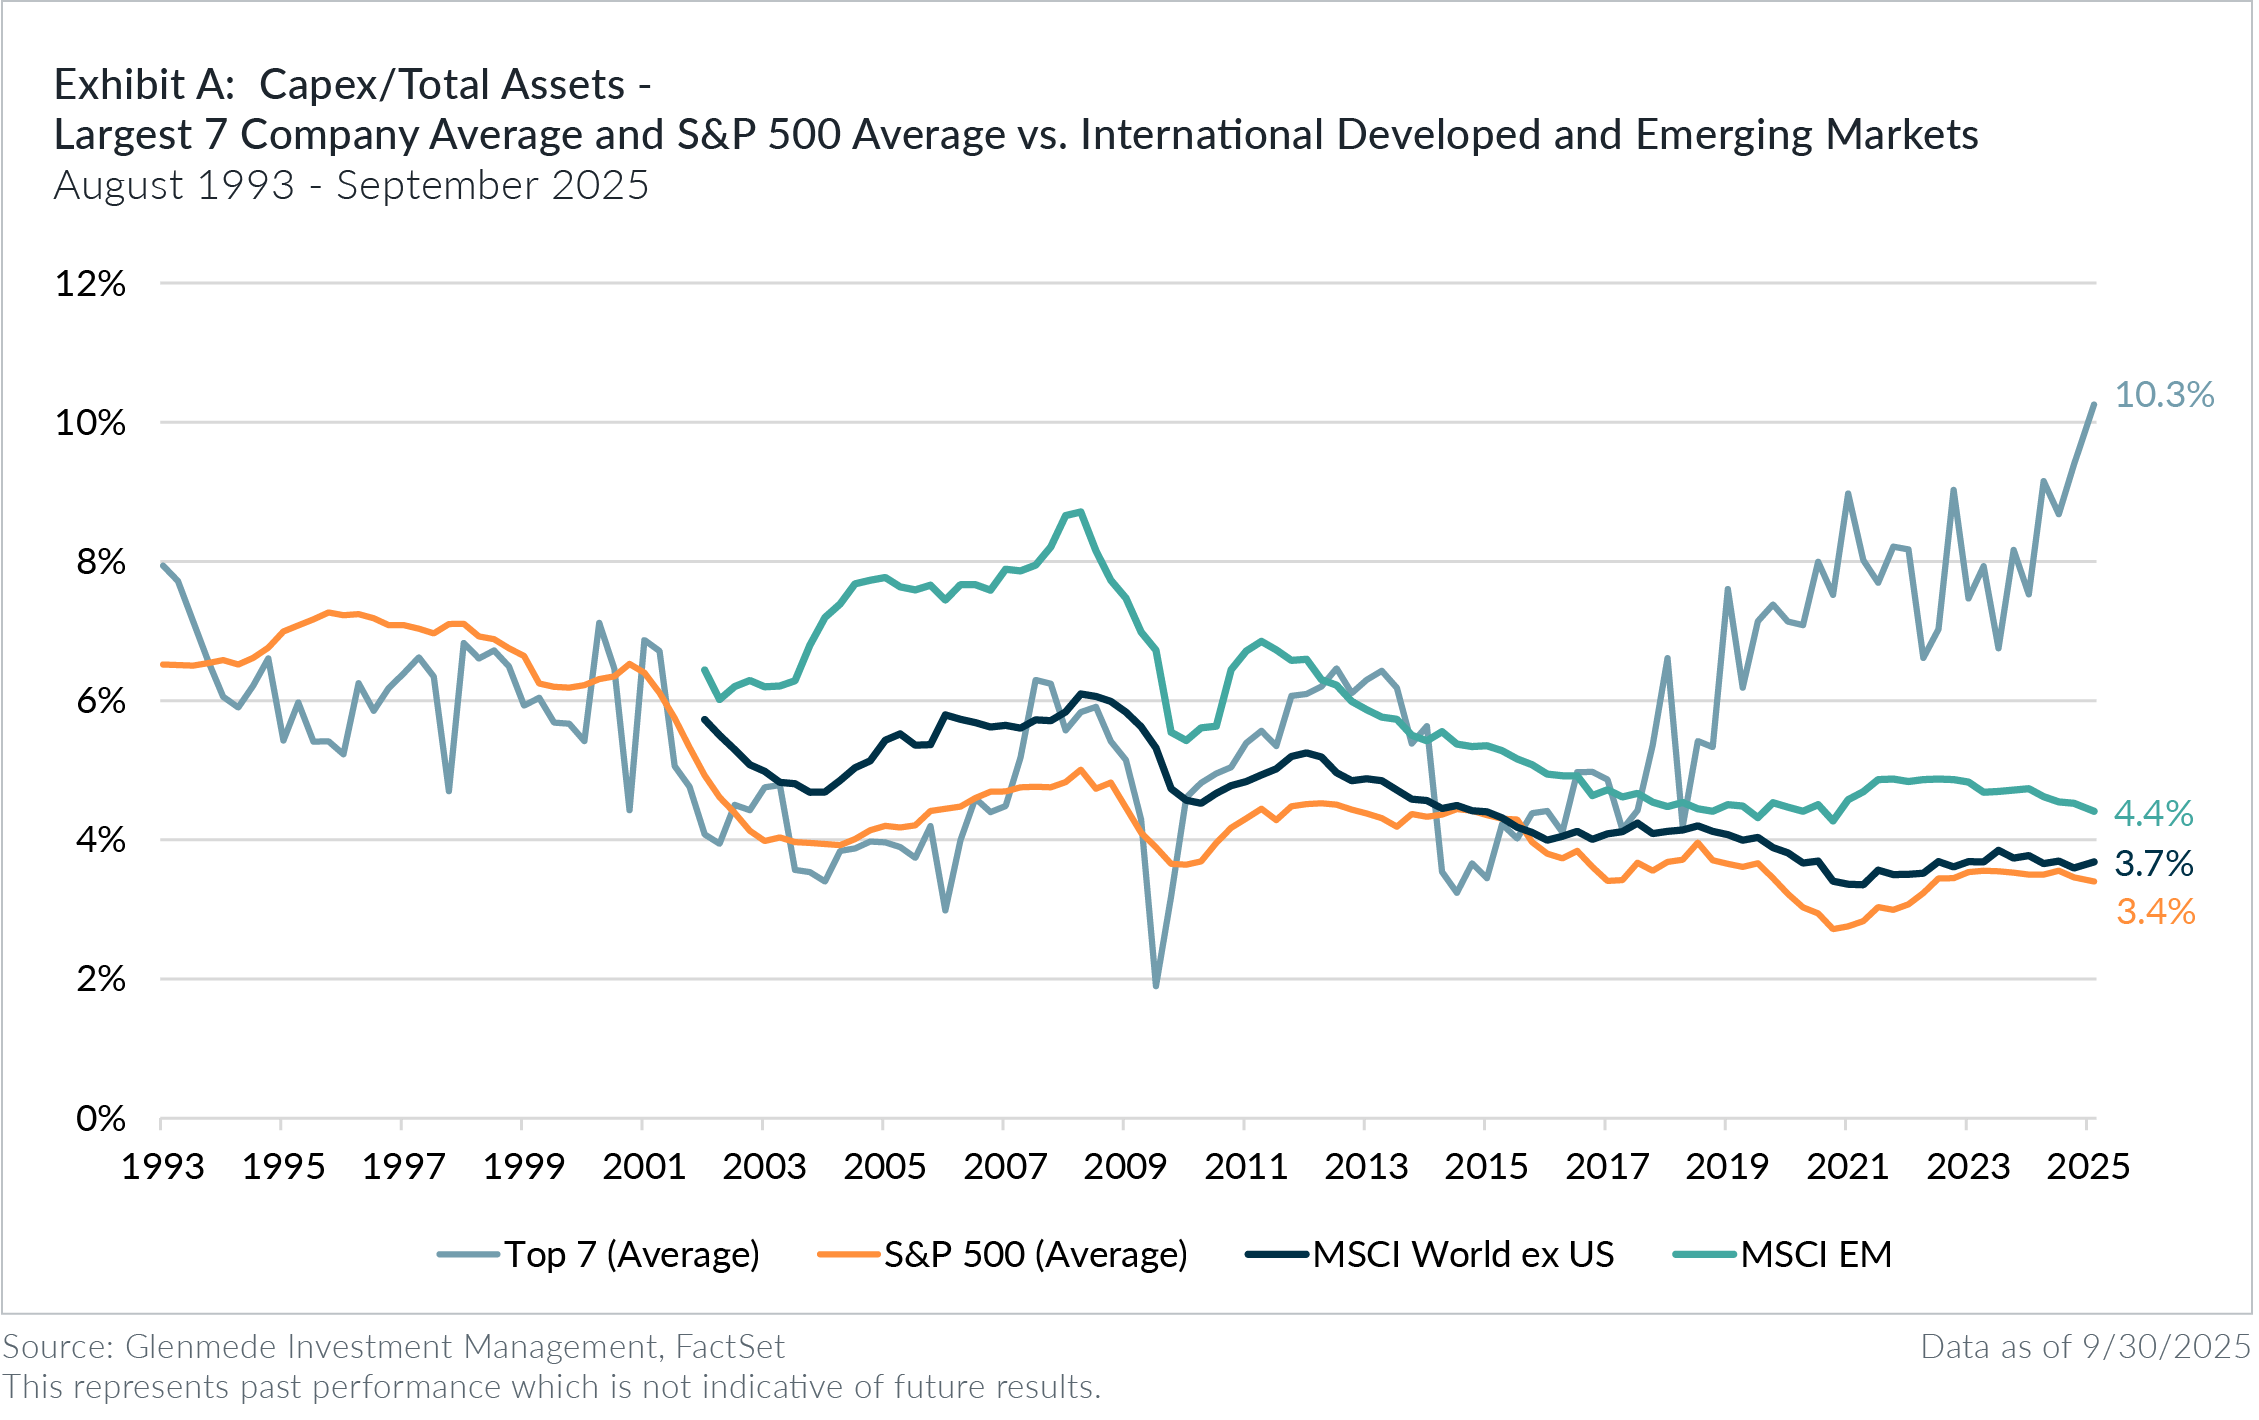
As covered in the popular financial press1, the boom in AI has led to capital expenditure (“capex”) levels not seen in recent history. Among the largest 7 names in the S&P 500, capital spending has risen from 3.4% of total net assets ten years ago to 10.3% currently, the highest level in at least 32 years.
Meanwhile, capex in the rest of the S&P 500 appears to be in a multi-decade declining trend, with the average name
spending only 3.4% of total assets. International markets mirror this trend, with developed markets companies spending 3.7% of assets and EM companies spending 4.4%; both levels are among the lowest we’ve seen since at least 2001. Thus, it can be largely said that the AI capex boom runs counter to the global trend and the majority of US large cap stocks.
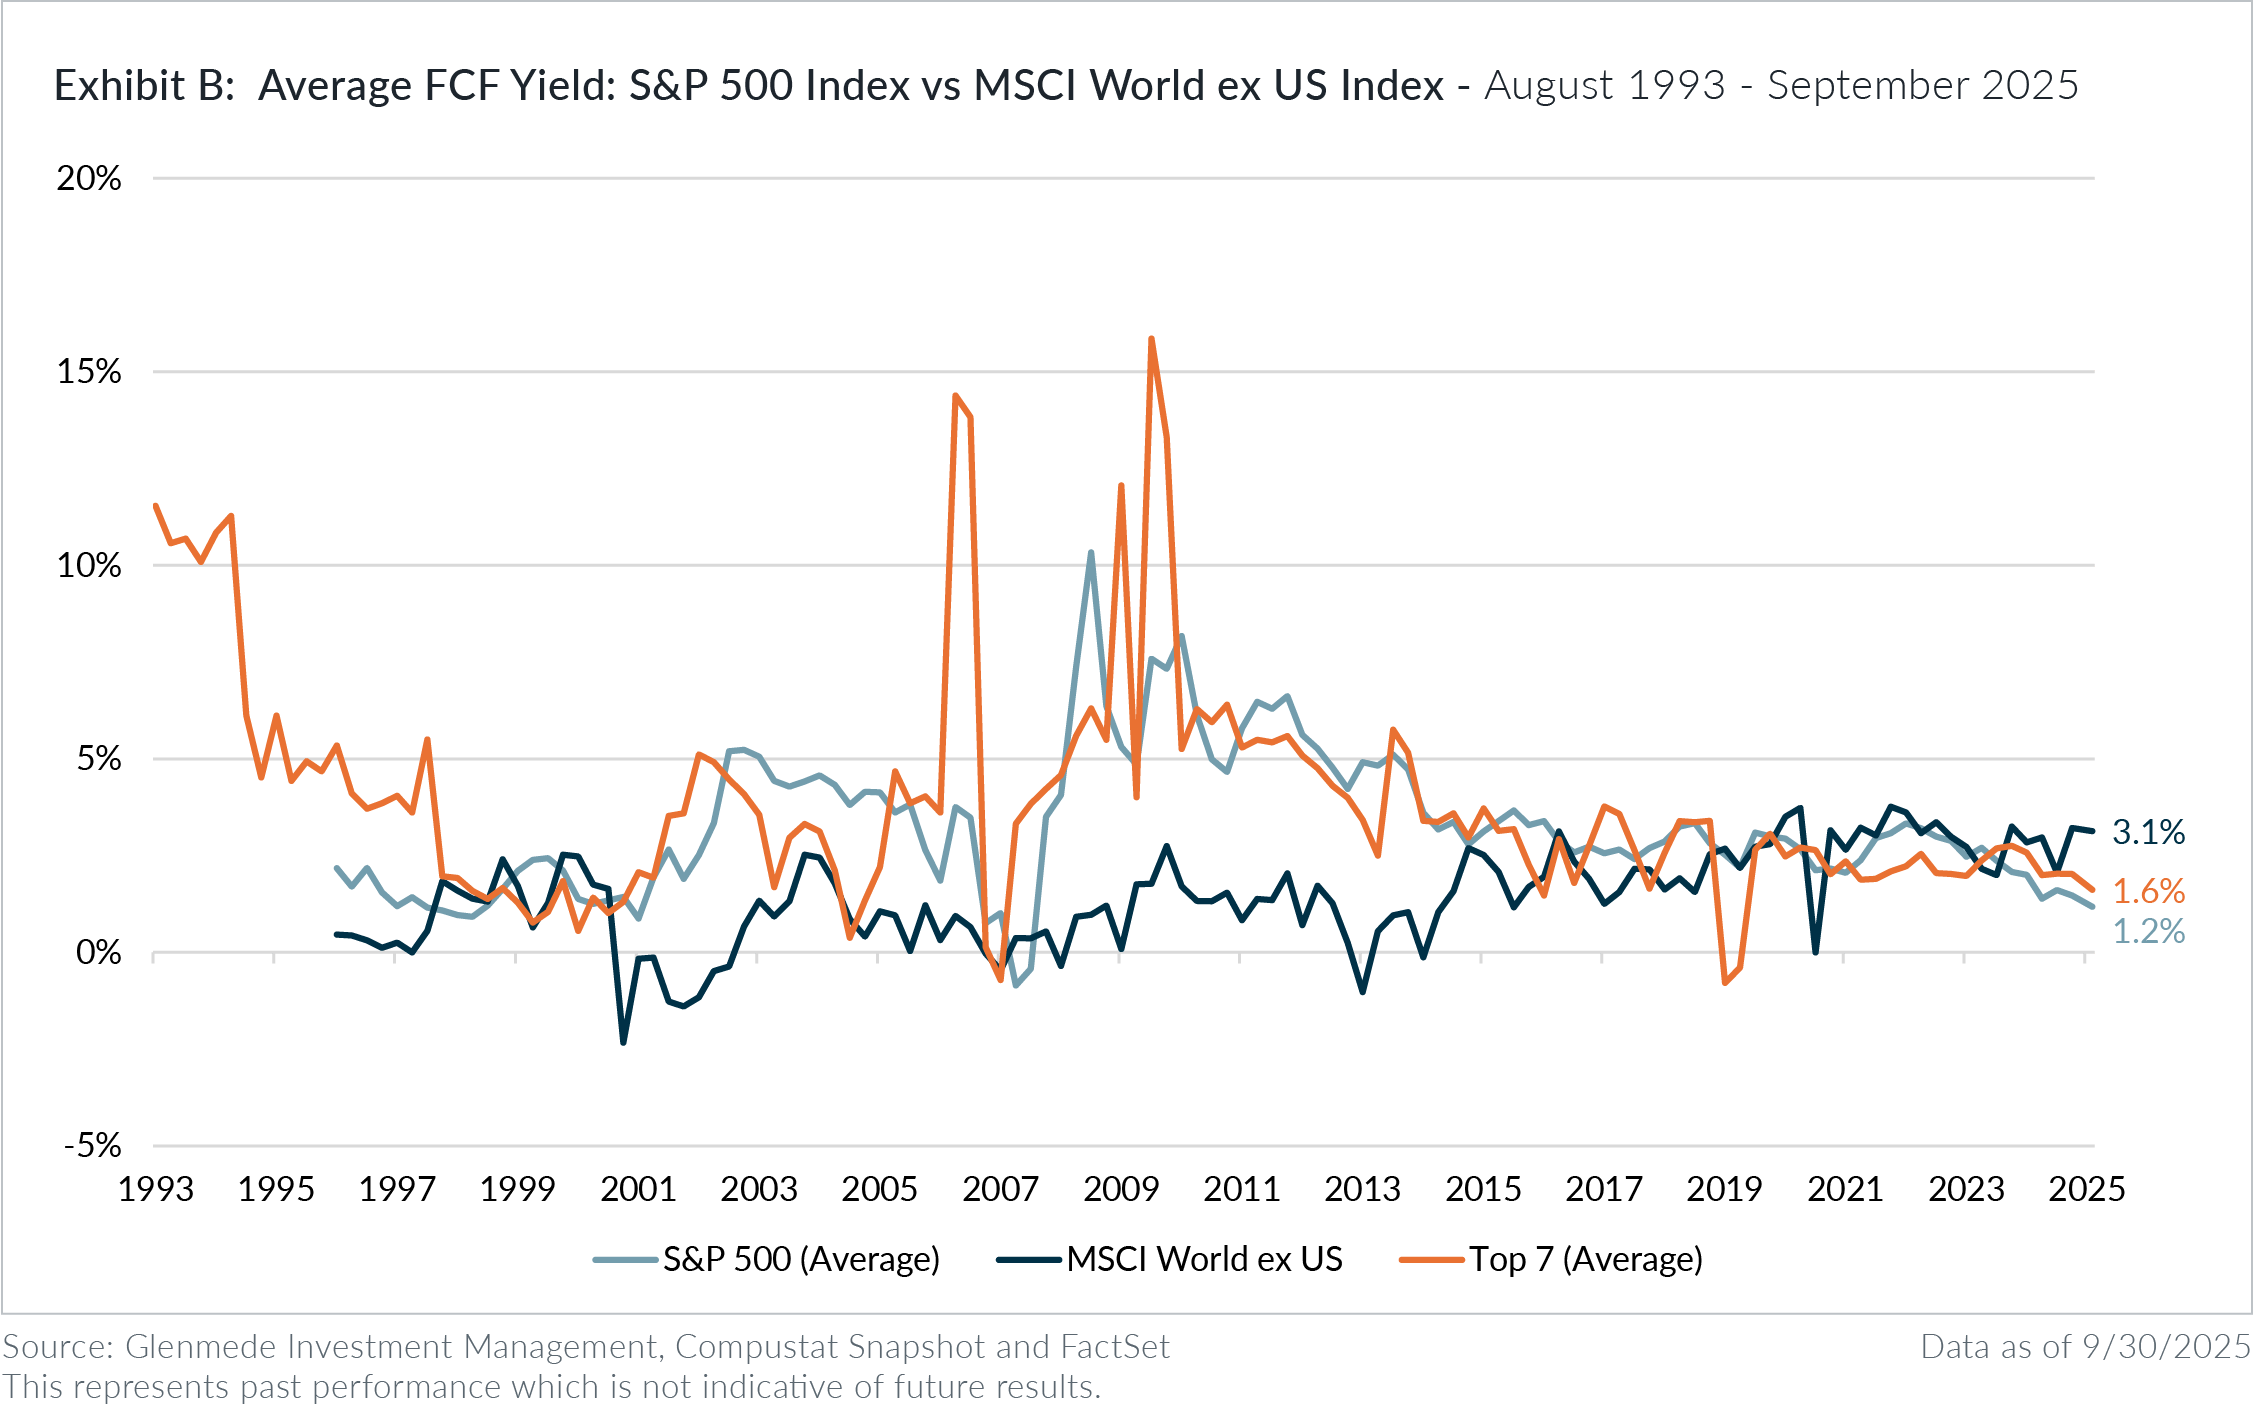
A common explanation for this spending boom is that AI companies have the cash flows to support this level of seemingly outsized expenditures. A holistic view of cash flow, however, shows that this is not quite the case. In the US, free cash flow yield for the average large cap stock (in the S&P 500 Index) has been declining over the past two years, falling from 3.3% to 1.2% at the end of September 2025. This is the lowest free cash flow yield for the average stock in the past 30 years outside of the depths of the Great Financial Crisis. Free cash flow bottomed in the internet bubble at 0.9%, leaving us nearly as extended on this metric as we were in late 1998. Despite the enormous cash flow generation of the Mag 7, their inordinate capital spending on AI, combined with their meteoric price increase, has caused them to look almost as expensive as the average S&P 500 company, with a free cash flow yield of 1.5%, on average.
International stocks tell a different story. While their free cash flow yields have bounced between about 0 and 2% in the peak of the internet bubble, yields have been steadily rising over the past two decades, and now sit at 3.1%, nearly 3x the free cash flow yield of the average stock in the S&P 500.
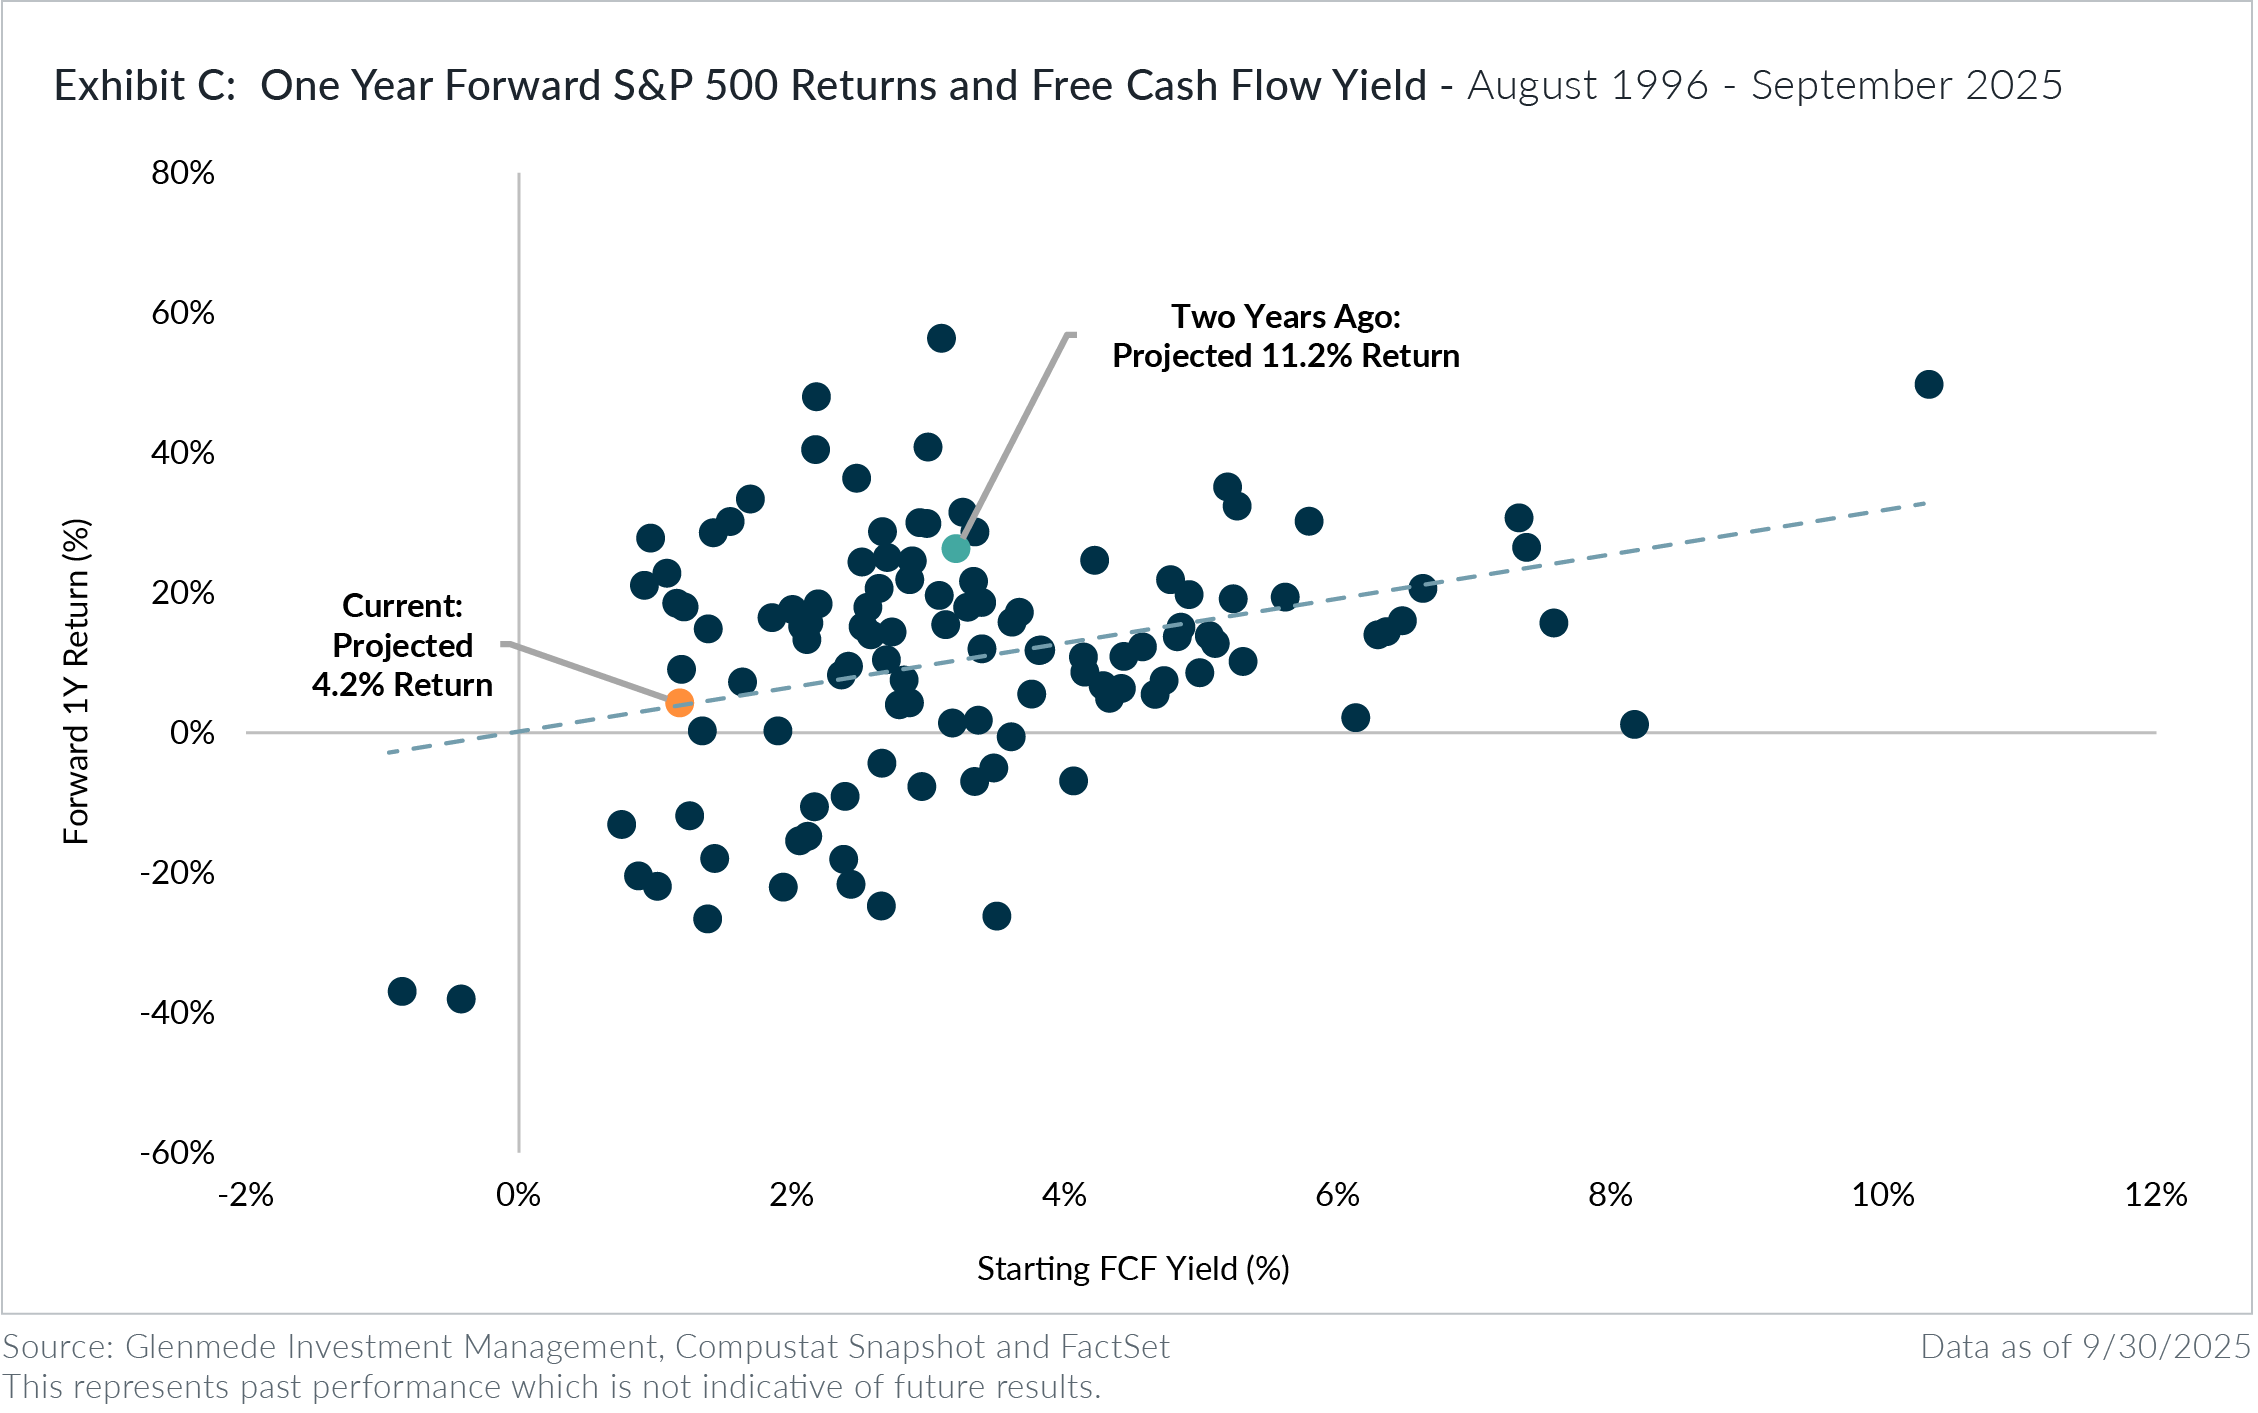
Our research has found a strong relationship between earnings yield and equity returns. In particular, the S&P 500 has tended to have a 3.3% lower forward one year return for every 1% decrease in the average free cash flow yield. While valuations have historically been better indicators of long-term returns than individual turning points, this relationship suggests that the spending surge in AI has shifted US equity markets to a significantly less attractive position than we saw just two years ago.
Speculative AI spending and the associated decrease in free cash flow yields are now pervasive in US large caps. In our view, this reinforces the case to diversify into developed international stocks. These markets appear well positioned to capitalize on similar earnings growth expectations as the US without extended valuations.
1 https://www.wsj.com/tech/ai/
This material was produced by Glenmede Investment Management, LP or its affiliate The Glenmede Trust Company, N.A. (collectively, “Glenmede”) for informational purposes and is not intended as personalized investment advice to purchase, sell or hold any investment or pursue any particular strategy. Opinions and analysis expressed in this material are those of the author or investment team as of the date of preparation and may change without this document being updated. Views expressed do not necessarily reflect the opinions of all investment personnel at Glenmede and may not be reflected in all the strategies and products offered. Forecasts or estimates provided herein, including those related to market outlook are based on research including publicly available information, internally developed data and third-party sources believed to be reliable, but accuracy cannot be guaranteed. Future results may differ significantly depending on market, security specific, economic or political conditions. Charts and graphs provided herein are for illustrative purposes only. Past performance is no guarantee of future results. Indexes mentioned are unmanaged and do not include any expenses, fees or sales charges. It is not possible to invest directly in an index. Any index referred to herein is the intellectual property (including registered trademarks) of the applicable licensor. Any product based on an index is in no way sponsored, endorsed, sold or promoted by the applicable licensor and it shall not have any liability with respect thereto. Financial intermediaries are only permitted to distribute this material in accordance with applicable law and regulation. Such financial intermediaries are required to satisfy themselves that the information in this material is appropriate for any person to whom they provide it. Glenmede shall not be liable for the use or misuse of this material by any such financial intermediary.