Market Snapshot: End of the Magnificent 7’s Asset-Light Era?
Over the past several years, the Magnificent 7–Alphabet, Amazon, Apple, Meta, Microsoft, Nvidia, and Tesla – have risen to dominate equity markets. One of the defining traits of that dominance has been the extraordinary free cash flow generation from these companies. In fact, the Magnificent 7 generated nearly as much free cash flow as the rest of the S&P 500 index combined in 2024.
This commanding position was not just about product leadership or innovation but also partly about the business models of these companies. They were largely asset-light and capex-efficient, allowing them to scale quickly and produce high margins with relatively low requirements for reinvestment. But that trend appears to be shifting.
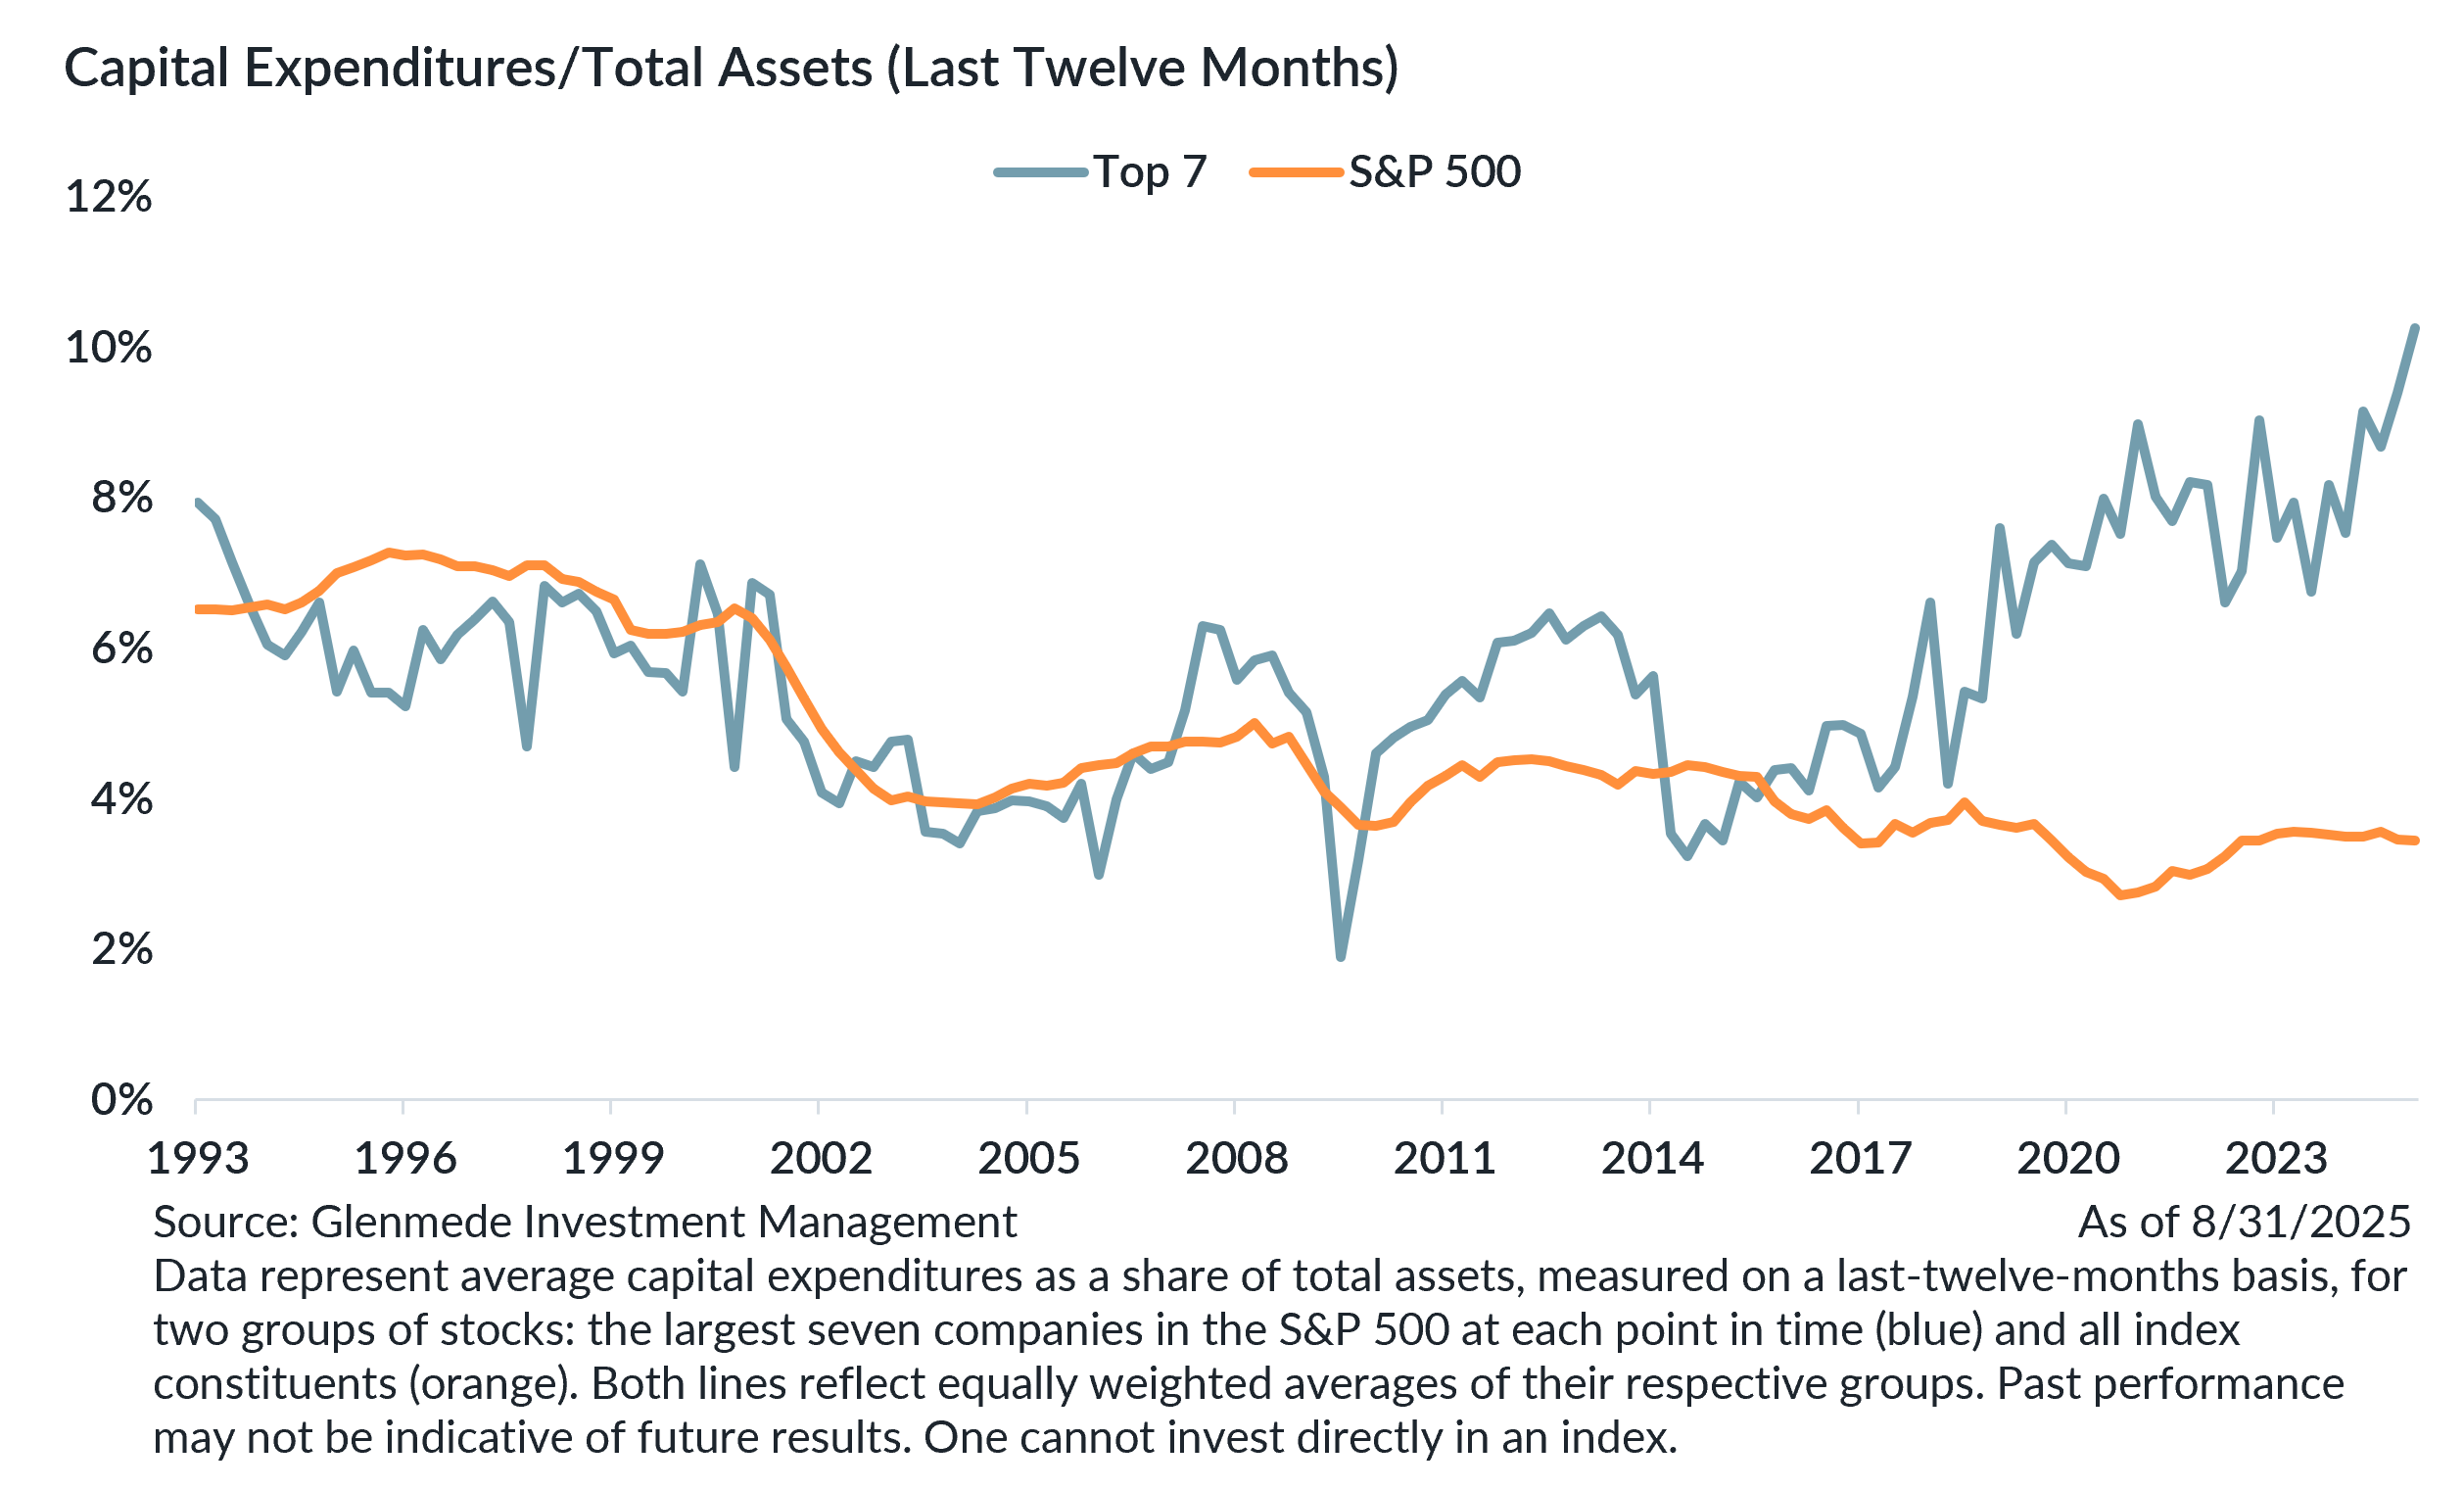
One of the bigger takeaways from Q2 earnings season is just how capex-intensive these businesses are becoming. For example, the ratio of capital expenditures to assets for the Magnificent 7 has now reached 10%, which is the highest point the largest seven stocks in the S&P 500 have reached since at least 1993 and easily outpaces the rest of the S&P 500. This shift is not just an accounting curiosity. It reflects a strategic pivot toward infrastructure buildout, particularly around AI, cloud computing, data centers, and supply chain reshoring.
Capex at this scale does not happen in a vacuum. It has ripple effects across the broader economy and markets. New projects breaking ground create real demand for equipment manufacturers, construction firms, utilities, and engineering services. Many of these industries are cyclical and have been out of favor in recent years. To the extent these tech giants reshore or expand their U.S. asset footprint, it could revitalize the domestic industrial base and create a source of durable demand across capital-intensive sectors. Additionally, if this capex cycle indirectly contributes to stronger economic growth, earnings results may broaden out beyond mega caps.
However, there is no guarantee that capital deployment translates into new sources of free cash flow. History is littered with examples of opportunities that seemed obvious at the time but ultimately led to overinvestment. For example, U.S. shale producers poured massive capex into drilling during the 2010s, driving rapid production growth which flooded the market and depressed prices. Given the steep decline rates of shale wells and spending that consistently outpaced cash flow, the sector delivered abundant energy but poor returns for investors.
Today, many of these projects, particularly around AI infrastructure, are long-duration in nature. If the return on capital falls short of expectations or if margins compress as a result of heavier reinvestment, investors may begin to rotate into other parts of the market that offer more immediate or tangible earnings momentum.
In the near term, this could be setting the stage for other portions of the market to outperform on a relative basis, especially those that stand to benefit directly from the investment cycle. And for the Magnificent 7 itself, they enter this stage with valuations that sit at notable premiums. High valuations imply elevated expectations and increased vulnerability if those expectations are not met.
Accordingly, the market landscape may be shifting from one dominated by just a handful of mega-cap tech stocks to one benefitting from more plentiful opportunities from the field. As the largest companies transition from capital-light compounding machines to firms with increasing asset intensity, the dominance of the cap-weighted index could begin to fade. A more balanced portfolio, one that avoids overreliance on the top-heavy structure of major benchmarks, may finally be positioned to benefit. For allocators with a long-term view, this could mark the beginning of a more favorable environment for diversified equity exposure.
John Kichula, CFA
Portfolio Manager, U.S. Large Cap Equity
Glenmede Investment Management
Mark Livingston, CFA
Portfolio Manager, U.S. Large Cap Equity
Glenmede Investment Management
This material was produced by Glenmede Investment Management, LP or its affiliate The Glenmede Trust Company, N.A. (collectively, “Glenmede”) for informational purposes and is not intended as personalized investment advice to purchase, sell or hold any investment or pursue any particular strategy. Opinions and analysis expressed in this material are those of the author or investment team as of the date of preparation and may change without this document being updated. Views expressed do not necessarily reflect the opinions of all investment personnel at Glenmede and may not be reflected in all the strategies and products offered. Forecasts or estimates provided herein, including those related to market outlook are based on research including publicly available information, internally developed data and third-party sources believed to be reliable, but accuracy cannot be guaranteed. Future results may differ significantly depending on market, security specific, economic or political conditions. Charts and graphs provided herein are for illustrative purposes only. Past performance is no guarantee of future results. Indexes mentioned are unmanaged and do not include any expenses, fees or sales charges. It is not possible to invest directly in an index. Any index referred to herein is the intellectual property (including registered trademarks) of the applicable licensor. Any product based on an index is in no way sponsored, endorsed, sold or promoted by the applicable licensor and it shall not have any liability with respect thereto. Financial intermediaries are only permitted to distribute this material in accordance with applicable law and regulation. Such financial intermediaries are required to satisfy themselves that the information in this material is appropriate for any person to whom they provide it. Glenmede shall not be liable for the use or misuse of this material by any such financial intermediary. References to individual securities should not be interpreted as a recommendation to buy, hold or sell.