Market Snapshot: Small Caps—If Not Now, When?
After eight consecutive years of underperformance relative to their large cap peers, some investors are questioning the utility of U.S. small cap equities for a diversified portfolio. Historically, U.S. markets have rotated between large and small cap leadership in cycles averaging about 11 years, dating back to the mid-1920s. Yet the current stretch, now in its 14th year, ranks among the longest periods of small cap underperformance on record.
Mean reversion can be a powerful force, but it is not necessarily a reliable timing tool. A case for small cap resurgence could have been made several times in recent years, but the trade never gained durable traction. This persistent lag has prompted some to wonder whether deeper structural factors are behind the growing skepticism from investors.
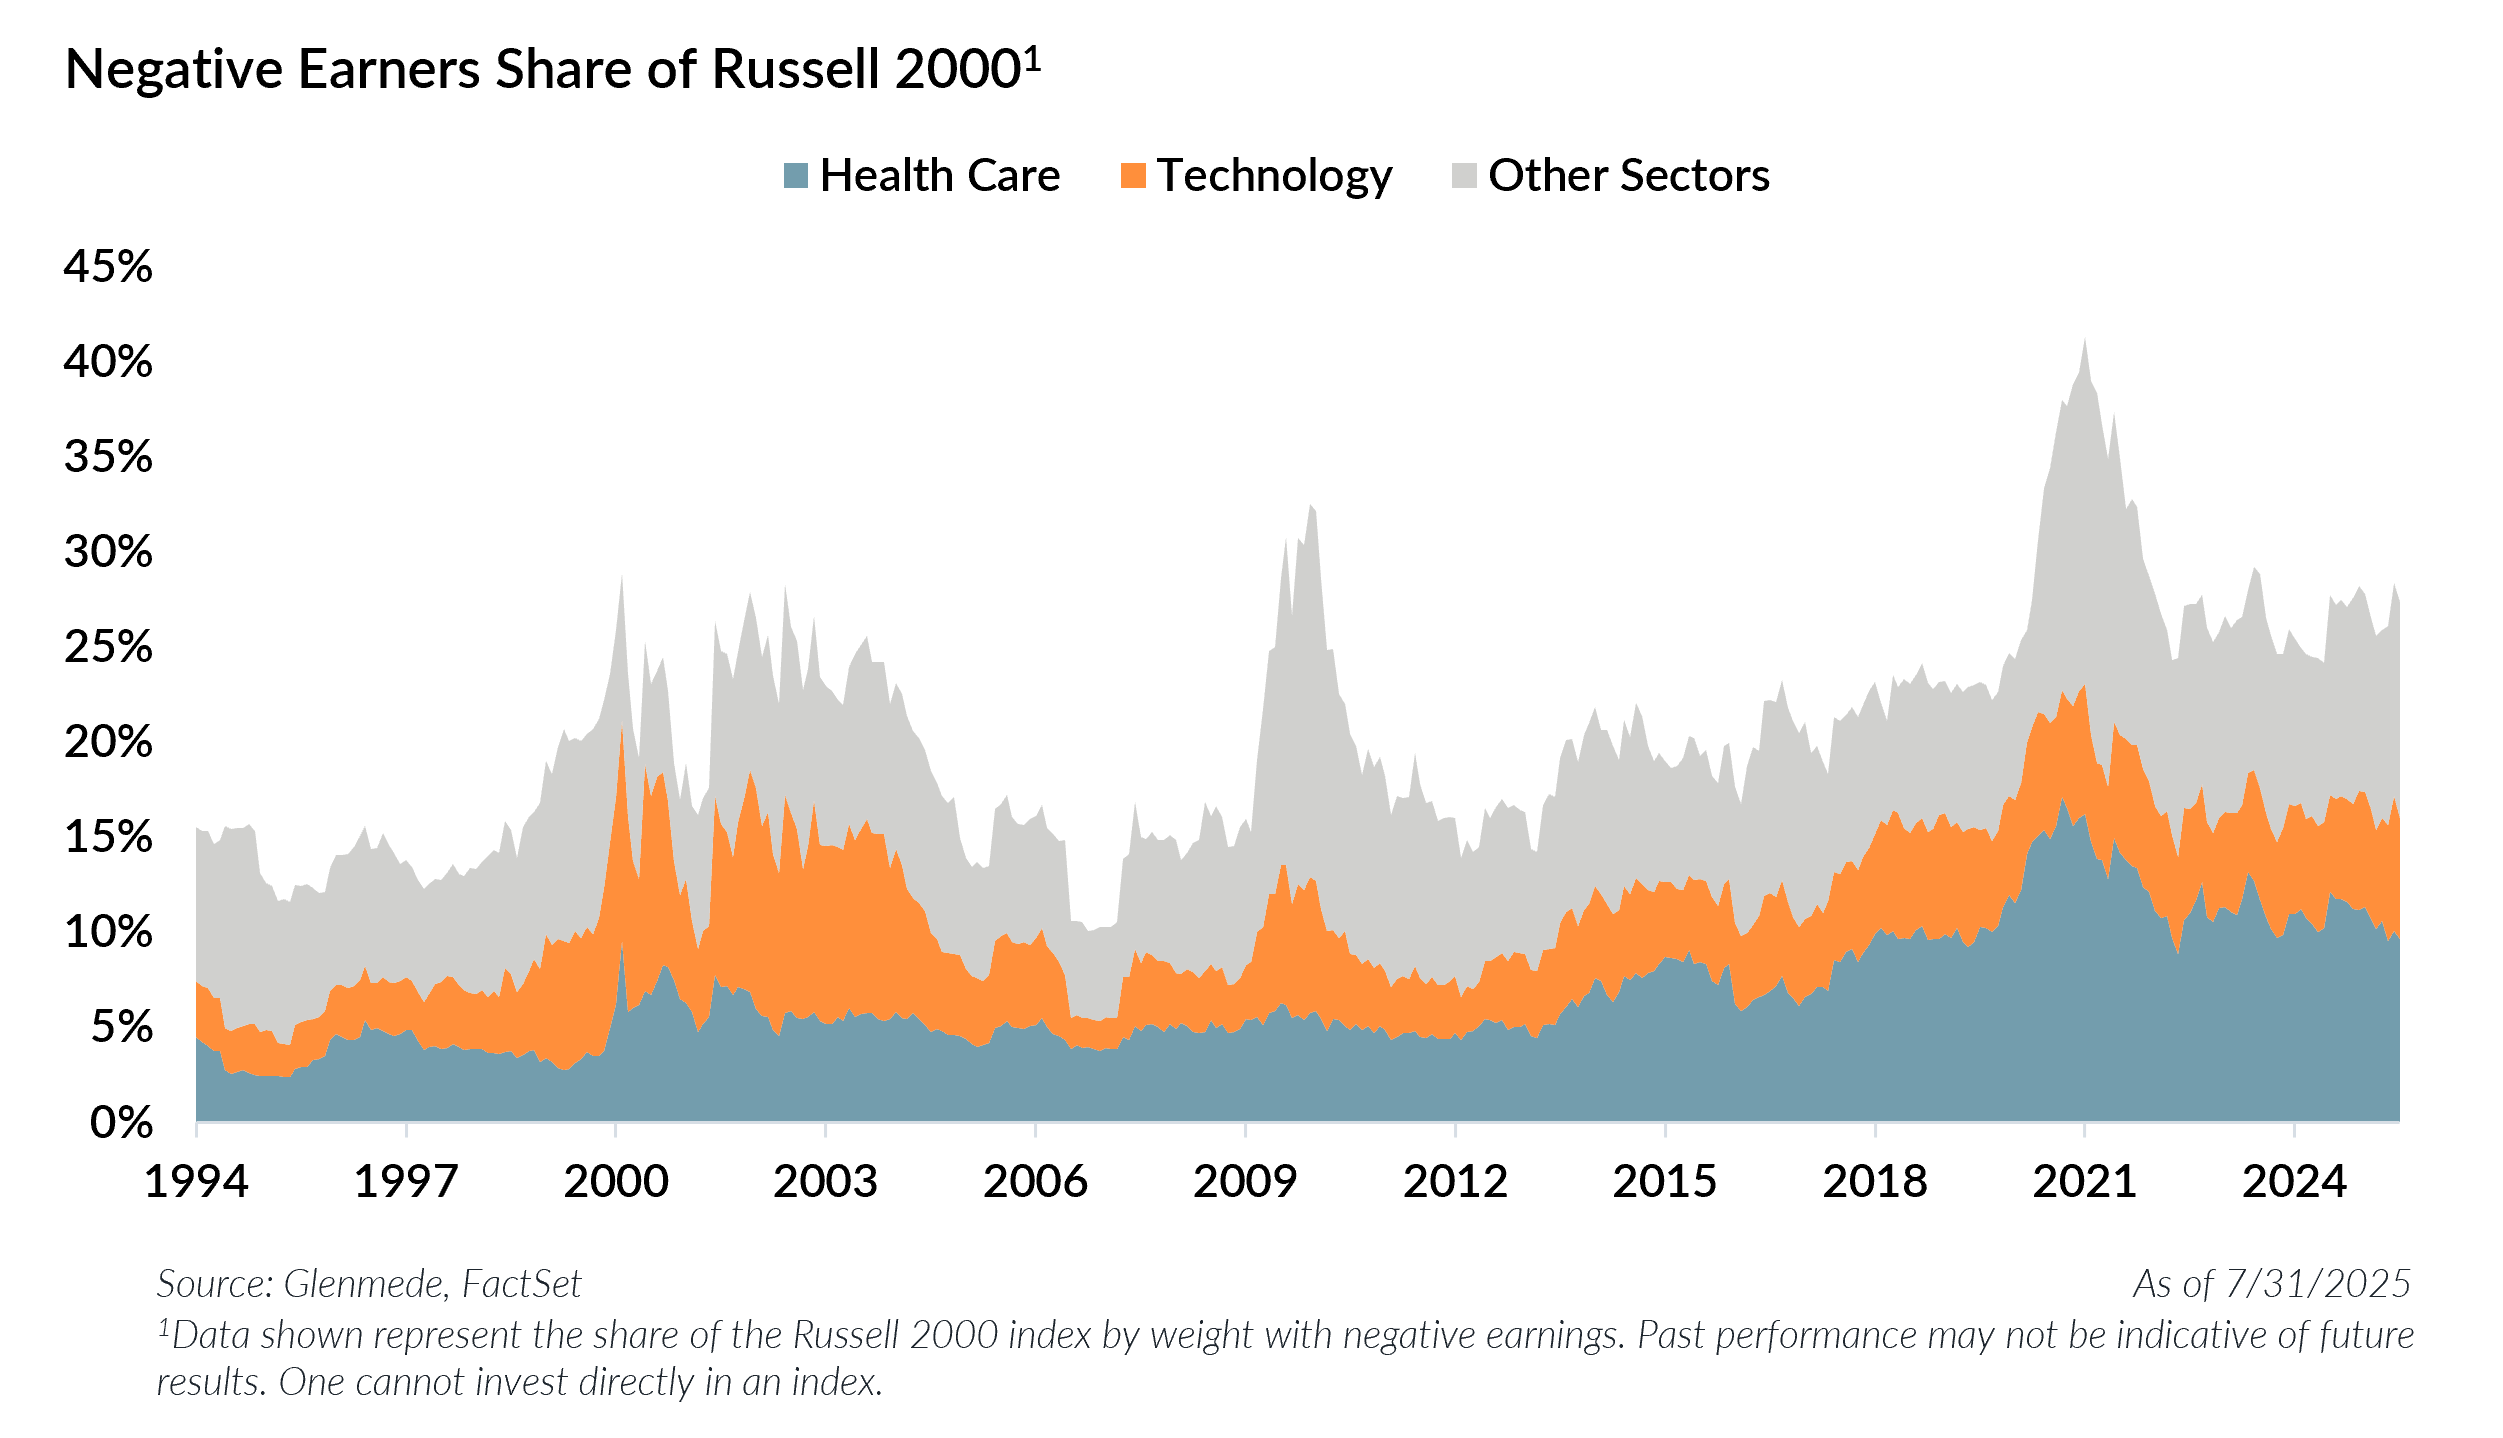
One common concern is the high share of unprofitable companies in the Russell 2000 index. While the proportion has declined from its COVID-era peak, the aggregate weight of negative earners remains comparable to levels seen during the Dot-Com Bubble and the Global Financial Crisis, dominated as usual by the health care and technology sectors.
A key driver of this trend has been the shrinking pool of publicly traded companies. In 2000, roughly 7,000 companies were listed on major U.S. exchanges; today, that number is closer to 4,300. In the past, innovative private firms often turned to initial public offerings (IPOs) to fund growth initiatives. That changed in the aftermath of the Global Financial Crisis, as heightened regulatory costs made public listings less attractive, and the Federal Reserve’s “zero interest rate policy” made private capital more accessible and affordable.
As the number of public companies declined, the private equity landscape expanded. There are now around 4,500 private equity sponsors managing portfolios of approximately 11,500 companies. These firms generally target profitable, high-quality businesses, leaving behind more speculative ventures. The combination of buyouts removing stronger companies from public markets and more muted IPO activity has led to a higher concentration of negative earners in the small cap universe.
There are, however, early signs of change. A more normalized interest rate environment appears to be reviving interest in public listings, especially as private equity firms face mounting pressure to exit aging investments. Through mid-June, 97 IPOs (excluding blank check companies) have been completed, up from 72 over the same period last year. Not only are more companies going public, but they are also smaller on average. If this trend continues, a broader and more dynamic group of new entrants could enhance the growth profile of the small cap universe and attract investors to the asset class.
If an era of abnormally low interest rates helped fuel the rise of unprofitable companies and weighed on small cap returns, a higher cost of capital could drive a reversal. Compounding this, small caps are trading at valuations that appear compelling by empirical standards. Glenmede estimates that the relative valuation gap between U.S. large cap and small cap equities is at the 90th percentile of its historical range.
Altogether, conditions may be forming for a long-awaited reversal of the persistent dominance of large cap companies, with small caps potentially primed for a new outperformance cycle.
Jordan Irving
Portfolio Manager, U.S. Small/Mid/SMID Cap Equity
Glenmede Investment Management
Matthew Shannon, CFA
Portfolio Manager, U.S. Small/Mid/SMID Cap Equity
Glenmede Investment Management
This material was produced by Glenmede Investment Management, LP or its affiliate The Glenmede Trust Company, N.A. (collectively, “Glenmede”) for informational purposes and is not intended as personalized investment advice to purchase, sell or hold any investment or pursue any particular strategy. Opinions and analysis expressed in this material are those of the author or investment team as of the date of preparation and may change without this document being updated. Views expressed do not necessarily reflect the opinions of all investment personnel at Glenmede and may not be reflected in all the strategies and products offered. Forecasts or estimates provided herein, including those related to market outlook are based on research including publicly available information, internally developed data and third-party sources believed to be reliable, but accuracy cannot be guaranteed. Future results may differ significantly depending on market, security specific, economic or political conditions. Charts and graphs provided herein are for illustrative purposes only. Past performance is no guarantee of future results. Indexes mentioned are unmanaged and do not include any expenses, fees or sales charges. It is not possible to invest directly in an index. Any index referred to herein is the intellectual property (including registered trademarks) of the applicable licensor. Any product based on an index is in no way sponsored, endorsed, sold or promoted by the applicable licensor and it shall not have any liability with respect thereto. Financial intermediaries are only permitted to distribute this material in accordance with applicable law and regulation. Such financial intermediaries are required to satisfy themselves that the information in this material is appropriate for any person to whom they provide it. Glenmede shall not be liable for the use or misuse of this material by any such financial intermediary.