The Quarterly Letter Q3 2025: Economic & Market Recap
Executive Summary
- Tariff volatility eased as key agreements took shape despite legal challenges. The U.S. economy proved resilient amid price pressures, though cracks began to appear in an otherwise balanced labor market.
- The One Big Beautiful Bill Act delivered front-loaded stimulus aimed at both consumers and businesses. The Federal Reserve cut rates by a quarter point, but the path forward for rates remained up for debate.
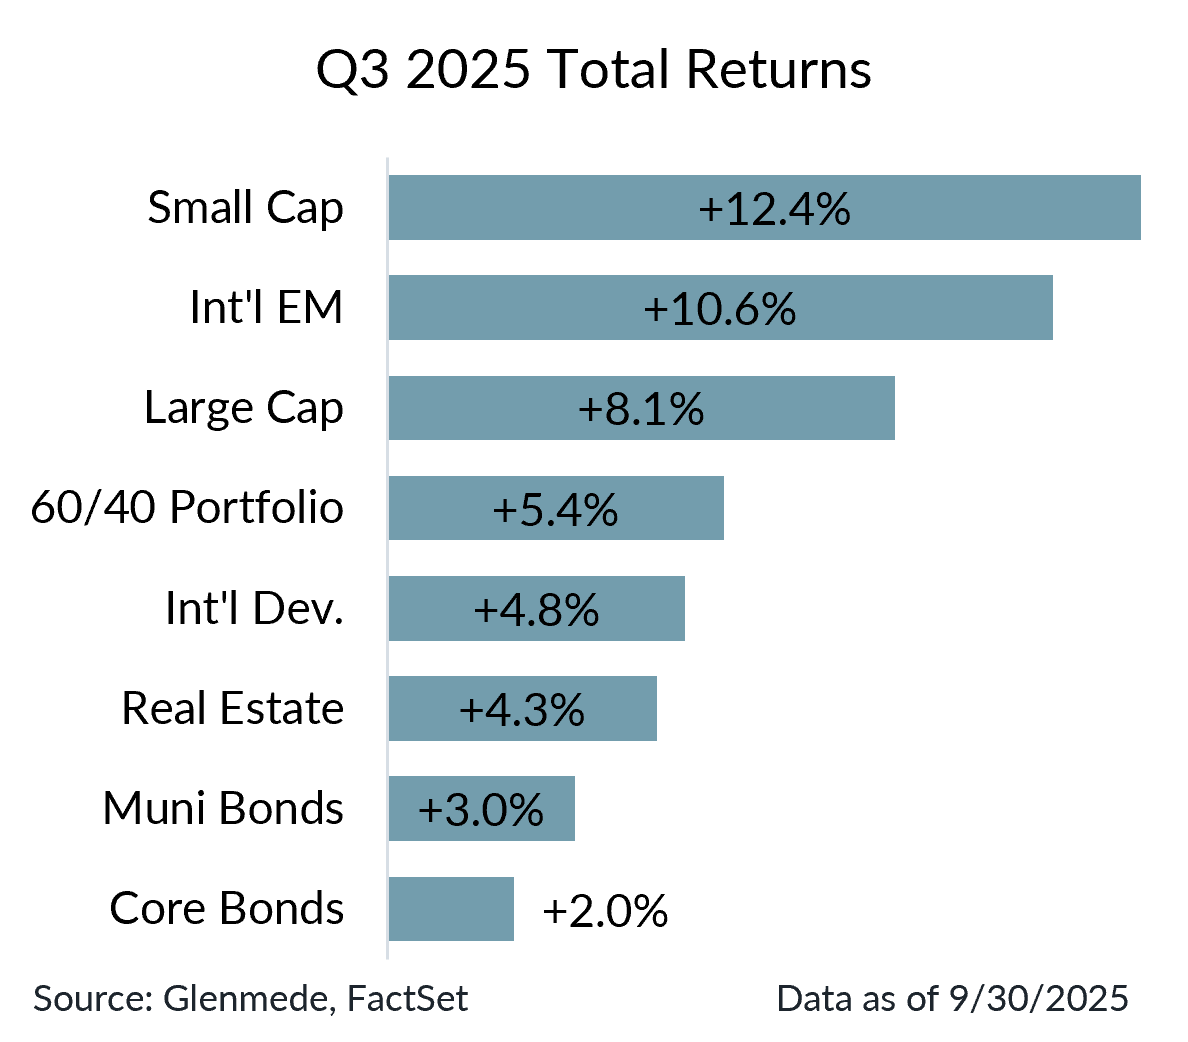
- Q3 saw broad market gains, led by small-cap equities, while large caps and emerging markets also advanced. Falling rates supported investment-grade and high yield credit, as well as municipal bonds.
- Recession risks have eased but remain non-zero. Key themes for the rest of 2025 include broadening earnings growth, surging capex, increasing tariff flow-throughs to inflation, further Fed easing, and continued dollar weakness.
From Trade Turmoil to Economic Resilience
After a turbulent Q2, the dust largely began to settle on tariff policy in Q3. The 90-day pause on country-specific tariffs was extended in early July to allow time for further negotiations, leading to bilateral agreements (e.g., Vietnam, European Union, South Korea, Japan) or letters outlining new terms (e.g., Thailand, Cambodia, Myanmar). Other countries faced tariff increases on U.S. exports for non-economic reasons: Brazil (50%), India (50%), Canada (35%). Beyond country-specific measures, product duties rose on copper and spread to new products, including pharmaceuticals, heavy trucks, kitchen cabinets, and upholstered furniture. Legal challenges to the tariffs continued, with a federal appeals court ruling some tariffs illegal, though they were allowed to remain in place pending review by the Supreme Court. At the same time, the administration readied backup tools to re-impose tariffs through other means, if needed.
Despite shifting trade policy, the U.S. economy demonstrated resilience. A strong Q2 GDP report eased fears of a mid-year recession, and growth expectations picked up for the rest of 2025. Consumer spending held at healthy levels, while businesses resumed capital investment plans, especially in those projects focused on AI infrastructure. Labor market data raised some concerns, as large revisions to nonfarm payrolls figures revealed considerably more sluggish employment growth. However, softer demand for workers, paired with reduced labor supply from immigration policy, kept the jobs market roughly in balance. Tariff costs also began filtering into consumer prices, though the impact was so far muted as companies worked through pre-tariff inventories before passing on meaningful price increases.
Stimulus, from Capitol Hill to the Fed
The One Big Beautiful Bill Act (OBBBA) passed Congress and was signed into law, extending expiring tax cuts, offering deductions for taxes on tips/overtime, raising the SALT cap, allowing full expensing for manufacturing structures, and introducing new excise taxes for private higher education. The legislation was structured to deliver front-loaded stimulus, offering a concrete catalyst to help offset the fiscal tightening from higher tariff rates. While not a perfect counterbalance, the combination set the stage for meaningful net stimulus in 2026. By quarter-end, the federal government again faced the risk of a shutdown.
The Federal Reserve maintained a cautious stance over the summer, assessing whether tariffs posed greater risks to inflation or growth. Concerns around Fed independence stirred after the administration sued to remove Governor Cook over mortgage irregularities. The Fed cut its policy rate by a quarter point in September, judging that risks to its full employment mandate required more attention. Its new dot plot projections pointed to some disagreement on the forward path of policy. The median respondent expected two more cuts in 2025, though many policymakers remained unconvinced that further reductions were needed.
Small Caps Lead Q3 Rally
Q3 was a strong quarter for most major asset classes as stocks rose and interest rates fell in tandem. Large cap equities continued their rebound from April lows, supported by resilient earnings despite higher tariffs. Concerns over mega cap dominance resurfaced as the Magnificent 7 came to represent ~35% of the S&P 500. Small caps led the quarter with strong double-digit gains, driven by improving fundamentals, discounted valuations, sensitivity to Fed rate cuts, and benefits from the OBBBA. Overseas, Asian markets saw strong gains, with Japanese, Chinese, and Korean equities among the top performers.
Domestic fixed income markets mostly benefitted from falling interest rates. While 10-year Treasury yields were largely unchanged, credit spreads tightened near historic lows for both investment-grade and high yield corporate bonds. Municipal bond yields also declined, aided by slower new issuance, robust demand, and relief that Congress did not remove their tax-exempt status as some had feared. Bitcoin posted modest gains (1.6%) as volatility declined following passage of the GENIUS Act and continued institutional adoption.
Rest of 2025: Top 5 Things to Watch
While tariffs increased recession risk earlier this year, this impact has faded alongside the decline in tariff fears, the passage of the OBBBA, and continued evidence of economic resilience. However, the risk of an economic downturn is non-zero, consistent with other late-stage expansions in U.S. history. Moving into the final months of 2025, there are several key dynamics to monitor with implications for the ongoing expansion and markets.
- Earnings & Corporate Guidance: Corporate earnings are expected to continue to broaden beyond the mega-cap tech leaders, particularly for small caps that should benefit from lower interest rates and tax breaks under the OBBBA.
- Capital Spending: Higher tariffs and tax incentives are encouraging businesses, especially in technology and AI, to accelerate spending. These capital expenditures should lead to direct economic stimulus, but investors should cast a skeptical eye as to whether those large investments will ultimately bear fruit.
- Inflation Effect of Tariffs: Tariffs are expected to add another 0.5–1.0% to inflation over the next 6–12 months. While businesses have absorbed much of this cost so far, consumers are expected to gradually bear more of the burden.
- Federal Reserve Easing: The Fed is likely to weigh the risks of labor market weakness and persistent inflation when deciding on further rate cuts. A base case of 1–2 more cuts before year-end may contribute to a steepening yield curve and continued easing of financial conditions.
- Direction of the Dollar: The dollar has eased from its historic highs but remains strong by historical standards. As policy rates converge, the dollar may weaken modestly, providing a tailwind for U.S. holdings abroad.
¹Asset classes are represented by the following: Large Cap (S&P 500), Small Cap (Russell 2000), Int’l Dev. (MSCI EAFE), Int’l EM (MSCI EM), Real Estate (FTSE EPRA/NAREIT Developed), Core Bonds (Bloomberg U.S. Aggregate), Muni Bonds (Bloomberg Municipal), 60/40 Portfolio (60% MSCI ACWI, 40% Bloomberg U.S. Aggregate). Past performance may not be indicative of future results. One cannot invest directly in an index.
This material was produced by Glenmede Investment Management, LP or its affiliate The Glenmede Trust Company, N.A. (collectively, “Glenmede”) for informational purposes and is not intended as personalized investment advice to purchase, sell or hold any investment or pursue any particular strategy. Opinions and analysis expressed in this material are those of the author or investment team as of the date of preparation and may change without this document being updated. Views expressed do not necessarily reflect the opinions of all investment personnel at Glenmede and may not be reflected in all the strategies and products offered. Forecasts or estimates provided herein, including those related to market outlook are based on research including publicly available information, internally developed data and third-party sources believed to be reliable, but accuracy cannot be guaranteed. Future results may differ significantly depending on market, security specific, economic or political conditions. Charts and graphs provided herein are for illustrative purposes only. Past performance is no guarantee of future results. Indexes mentioned are unmanaged and do not include any expenses, fees or sales charges. It is not possible to invest directly in an index. Any index referred to herein is the intellectual property (including registered trademarks) of the applicable licensor. Any product based on an index is in no way sponsored, endorsed, sold or promoted by the applicable licensor and it shall not have any liability with respect thereto. Financial intermediaries are only permitted to distribute this material in accordance with applicable law and regulation. Such financial intermediaries are required to satisfy themselves that the information in this material is appropriate for any person to whom they provide it. Glenmede shall not be liable for the use or misuse of this material by any such financial intermediary.