Market Snapshot: When the Giants Break Ranks
For much of the past decade, leadership among the largest stocks in the S&P 500 has been defined not only by outsized returns, but also by remarkable uniformity. The market’s biggest companies tended to move together, reinforcing concentration and amplifying the dominance in capitalization-weighted benchmarks. That dynamic now appears to be changing.
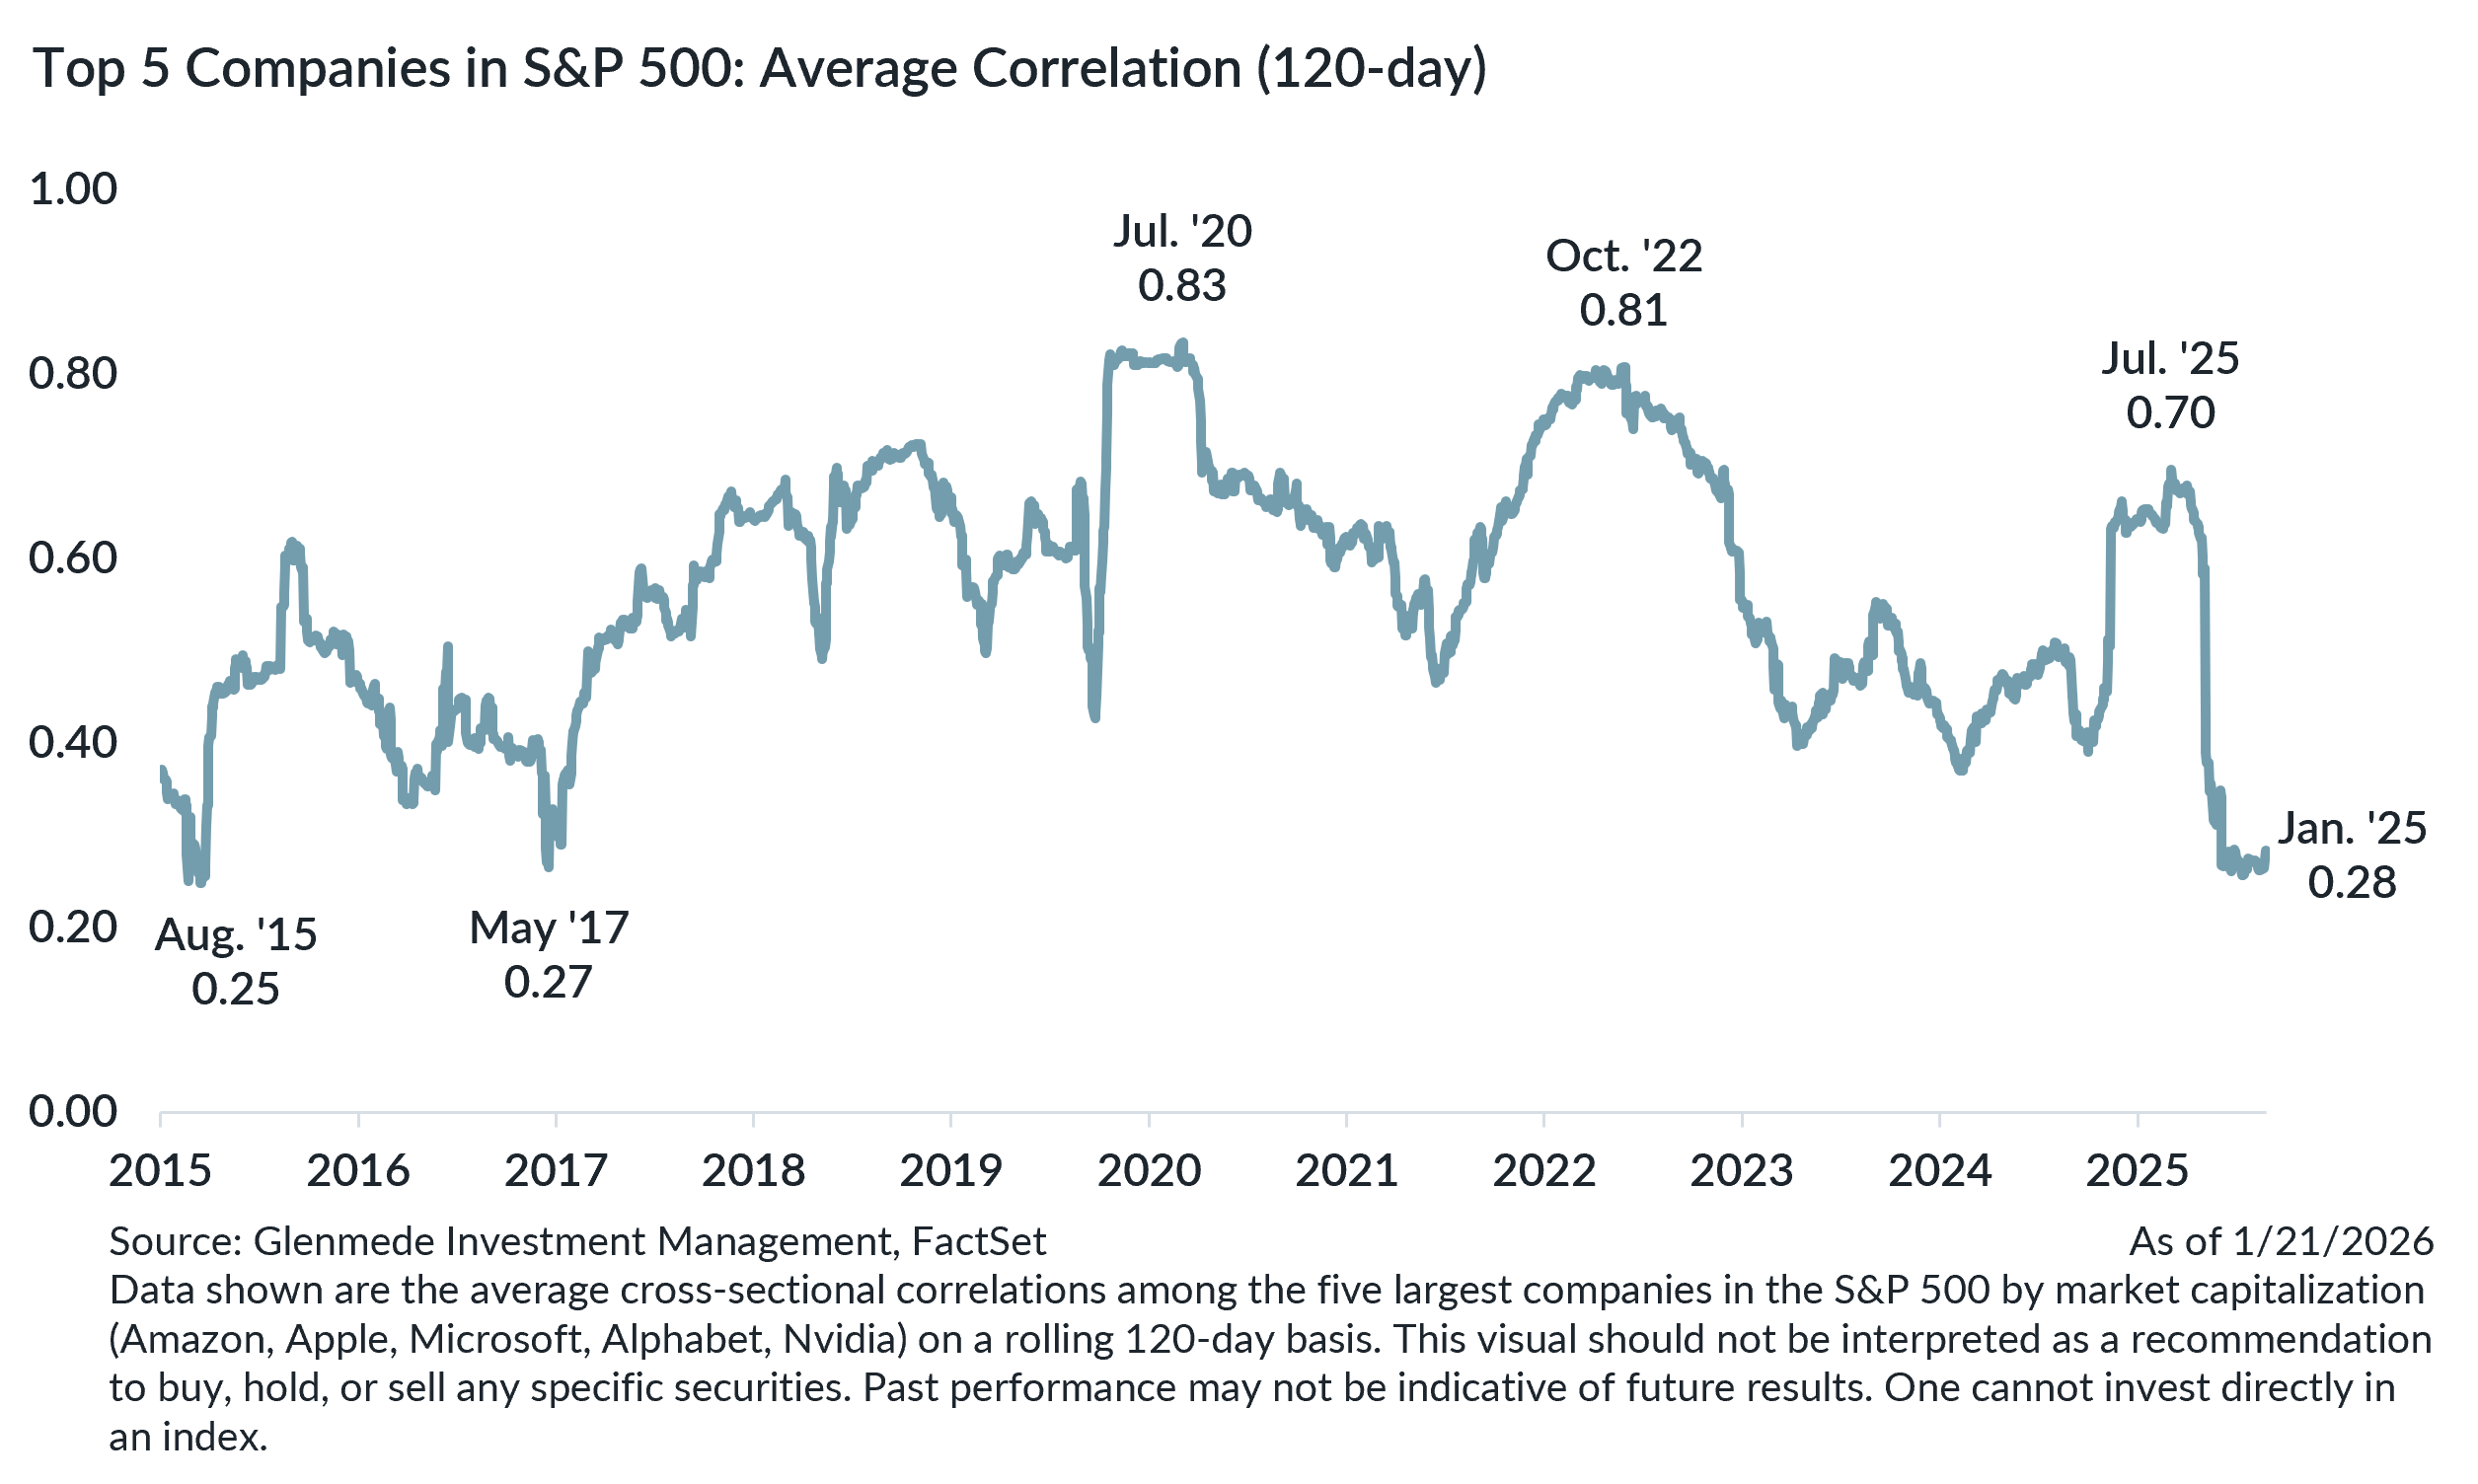
In 2025, only two members (Nvidia and Alphabet) of the Magnificent 7 outperformed the broader market, a sharp departure from the synchronized leadership that has characterized recent years. Beneath the surface, correlations among the largest stocks have broken down meaningfully. The average rolling 120-day cross-sectional correlation among the top five companies in the S&P 500 has fallen to 0.28. This marks the lowest level since 2017, which is right around the time when the Magnificent 7 began their ascent to market dominance. For perspective, this same measure peaked at 0.83 in July 2020 as the market recovered from the early stages of the pandemic.
Periods of elevated correlation at the top of the market can often reflect capital flow dynamics rather than careful selectivity among investors. In both the post-pandemic rally and the more recent AI-led surge, passive inflows and retail participation reinforced a tendency to treat the largest stocks as a single trade. As enthusiasm has now begun to fade, particularly among some AI-exposed firms, investors are beginning to draw sharper distinctions between businesses, driven by fundamentals rather than indiscriminate speculation.
A similar pattern emerged during the late stages of the Internet Bubble. In that episode, correlations among the largest stocks declined abruptly, falling from roughly 0.60 in early 1999 to near 0.25 by late 2000. What followed was a prolonged re-sorting of returns. Over the subsequent five years, the average stock in the S&P 500 outperformed the cap-weighted index by more than 10% per year as leadership broadened and valuations were increasingly underpinned by fundamentals.
Markets rarely follow identical scripts, and turning points are difficult to identify with precision. Still, today’s backdrop shares important features with prior transitions: elevated concentration, rising dispersion among market leaders, and growing sensitivity to company-specific fundamentals. Importantly, this shift may not necessarily mean that mega caps are due for a correction. It merely suggests that returns become less uniform and broader based in 2026.
Such environments have historically favored broader participation across sectors, styles, and geographies. With economic growth showing signs of improvement globally and earnings momentum expected to extend beyond the technology sector, conditions appear more supportive of opportunities beyond domestic mega cap stocks. After several years in which market leadership was unusually narrow, early signs of dispersion at the top may signal a healthier and more balanced phase for equity markets ahead.
Val deVassal, CFA
Portfolio Manager, Disciplined Equity
Glenmede Investment Management
Alex Atanasiu, CFA
Portfolio Manager, Disciplined Equity
Glenmede Investment Management
This material was produced by Glenmede Investment Management, LP or its affiliate The Glenmede Trust Company, N.A. (collectively, “Glenmede”) for informational purposes and is not intended as personalized investment advice to purchase, sell or hold any investment or pursue any particular strategy. Opinions and analysis expressed in this material are those of the author or investment team as of the date of preparation and may change without this document being updated. Views expressed do not necessarily reflect the opinions of all investment personnel at Glenmede and may not be reflected in all the strategies and products offered. Forecasts or estimates provided herein, including those related to market outlook are based on research including publicly available information, internally developed data and third-party sources believed to be reliable, but accuracy cannot be guaranteed. Future results may differ significantly depending on market, security specific, economic or political conditions. Charts and graphs provided herein are for illustrative purposes only. Past performance is no guarantee of future results. Indexes mentioned are unmanaged and do not include any expenses, fees or sales charges. It is not possible to invest directly in an index. Any index referred to herein is the intellectual property (including registered trademarks) of the applicable licensor. Any product based on an index is in no way sponsored, endorsed, sold or promoted by the applicable licensor and it shall not have any liability with respect thereto. Financial intermediaries are only permitted to distribute this material in accordance with applicable law and regulation. Such financial intermediaries are required to satisfy themselves that the information in this material is appropriate for any person to whom they provide it. Glenmede shall not be liable for the use or misuse of this material by any such financial intermediary.