Skip to Main Content
Glenmede Separately Managed Accounts

Glenmede Separately Managed Accounts

As of 8/31/23
QTD
YTD
1 Year
3 Year
5 Year
10 Year
Since Inception
Inception Date
Small Cap Equity (gross)
1.37 %
10.86 %
11.36 %
17.89 %
7.40 %
10.13 %
11.20 %
03/31/1991
Small Cap Equity (net)
1.20 %
10.14 %
10.27 %
16.73 %
6.34 %
9.04 %
10.33 %
03/31/1991
Russell 2000 Index
0.81 %
8.96 %
4.65 %
8.12 %
3.14 %
7.96 %
9.20 %
03/31/1991
Strategic Equity (gross)
2.92 %
16.81 %
20.19 %
12.27 %
10.23 %
12.80 %
9.62 %
03/31/2004
Strategic Equity (net)
2.80 %
16.24 %
19.31 %
11.44 %
9.42 %
11.97 %
8.81 %
03/31/2004
S&P 500 Index
1.57 %
18.73 %
15.94 %
10.52 %
11.12 %
12.81 %
9.56 %
03/31/2004
Equity Income (gross)
0.52 %
4.61 %
12.05 %
12.00 %
9.60 %
11.37 %
9.59 %
12/31/2004
Equity Income (net)
0.40 %
4.09 %
11.22 %
11.17 %
8.79 %
10.55 %
8.78 %
12/31/2004
S&P 500 Index
1.57 %
18.73 %
15.94 %
10.52 %
11.12 %
12.81 %
9.45 %
12/31/2004
Russell 1000 Value Index
0.72 %
5.88 %
8.59 %
11.59 %
7.11 %
9.15 %
7.41 %
12/31/2004
Fact Sheet
Commentary
Small Cap Equity
Strategic Equity
Equity Income
As of 8/31/23
QTD
YTD
1 Year
3 Year
5 Year
10 Year
Since Inception
Inception Date
Quantitative U.S. Large Cap Core Equity (gross)
1.81 %
11.44 %
12.71 %
10.94 %
7.50 %
11.53 %
9.59 %
03/31/2002
Quantitative U.S. Large Cap Core Equity (net)
1.68 %
10.89 %
11.88 %
10.12 %
6.70 %
10.70 %
8.78 %
03/31/2002
Russell 1000 Index
1.63 %
18.58 %
15.40 %
9.93 %
10.77 %
12.55 %
8.82 %
03/31/2002
Quantitative U.S. Large Cap Growth Equity (gross)
1.37 %
16.58 %
13.79 %
10.38 %
11.96 %
14.88 %
12.52 %
12/31/2002
Quantitative U.S. Large Cap Growth Equity (Net)
1.24 %
16.01 %
12.95 %
9.56 %
11.13 %
14.03 %
11.69 %
12/31/2002
Russell 1000 Growth Index
2.44 %
32.17 %
21.94 %
8.25 %
13.81 %
15.63 %
11.90 %
12/31/2002
Quantitative U.S. Large Cap Value Equity (gross)
1.64 %
4.22 %
7.90 %
13.93 %
6.64 %
#N/A %
8.21 %
04/30/2015
Quantitative U.S. Large Cap Value Equity (net)
1.52 %
3.71 %
7.10 %
13.09 %
5.85 %
#N/A %
7.41 %
04/30/2015
Russell 1000 Value Index
0.72 %
5.88 %
8.59 %
11.59 %
7.11 %
9.15 %
7.81 %
04/30/2015
Quantitative U.S. Small Cap Equity (gross)
2.95 %
8.77 %
11.07 %
17.80 %
7.30 %
#N/A %
8.56 %
11/30/2017
Quantitative U.S. Small Cap Equity (net)
2.78 %
8.05 %
9.97 %
16.64 %
6.31 %
#N/A %
7.58 %
11/30/2017
Russell 2000 Index
0.81 %
8.96 %
4.65 %
8.12 %
3.14 %
7.96 %
5.06 %
11/30/2017
Quantitative International Equity (Gross)
-0.02 %
14.44 %
22.53 %
8.54 %
4.02 %
4.63 %
6.78 %
11/30/1988
Quantitative International Equity (Net)
-0.14 %
13.88 %
21.63 %
7.74 %
3.24 %
3.81 %
6.19 %
11/30/1988
MSCI World ex US Index
-0.76 %
10.45 %
16.45 %
6.28 %
4.31 %
4.91 %
4.77 %
11/30/1988
Quantitative U.S. Large Cap 130/ 30 Equity (gross)
0.35 %
3.01 %
6.30 %
11.18 %
6.58 %
10.81 %
9.27 %
12/31/2005
Quantitative U.S. Large Cap 130/ 30 Equity (net)
0.18 %
2.33 %
5.25 %
10.09 %
5.57 %
9.87 %
8.40 %
12/31/2005
Russell 1000 Index
1.63 %
18.58 %
15.40 %
9.93 %
10.77 %
12.55 %
9.68 %
12/31/2005
Quantitative U.S. Total Market Equity (gross)
0.65 %
9.23 %
10.60 %
17.70 %
8.58 %
12.17 %
8.87 %
12/31/2006
Quantitative U.S. Total Market Equity (net)
0.48 %
8.51 %
9.51 %
16.36 %
7.28 %
10.82 %
7.55 %
12/31/2006
Russell 3000 Index
1.59 %
18.01 %
14.76 %
9.81 %
10.25 %
12.23 %
9.17 %
12/31/2006
Quantitative U.S. Long/Short Equity (gross)
1.92 %
5.48 %
9.36 %
10.91 %
3.68 %
5.13 %
4.02 %
11/30/2006
Quantitative U.S. Long/Short Equity (net)
1.71 %
4.61 %
8.02 %
9.55 %
2.40 %
3.84 %
2.74 %
11/30/2006
Russell 3000 Index
1.59 %
18.01 %
14.76 %
9.81 %
10.25 %
12.23 %
9.20 %
11/30/2006
70 FTSE 3-Month U.S. T-Bill/ 30 Russell 3000
0.92 %
3.33 %
4.44 %
1.63 %
1.68 %
1.07 %
1.08 %
11/30/2006
Responsible ESG U.S. Equity (gross)
1.74 %
9.15 %
11.02 %
10.90 %
7.97 %
#N/A %
11.70 %
12/31/2015
Responsible ESG U.S. Equity (net)
1.61 %
8.61 %
10.20 %
10.08 %
7.17 %
#N/A %
10.88 %
12/31/2015
Russell 1000 Index
1.63 %
18.58 %
15.40 %
9.93 %
10.77 %
12.55 %
12.71 %
12/31/2015
Quantitative U.S. Large Cap Faith-Based Equity (gross)
1.63 %
14.86 %
15.77 %
12.88 %
8.57 %
11.83 %
10.01 %
06/30/2008
Quantitative U.S. Large Cap Faith-Based Equity (net)
1.51 %
14.30 %
14.92 %
12.04 %
7.77 %
11.00 %
9.19 %
06/30/2008
Russell 1000 Index
1.63 %
18.58 %
15.40 %
9.93 %
10.77 %
12.55 %
10.76 %
06/30/2008
Women in Leadership U.S. Equity (gross)
1.69 %
11.12 %
13.79 %
11.20 %
8.15 %
#N/A %
11.05 %
12/31/2015
Women in Leadership U.S. Equity (net)
1.57 %
10.58 %
12.95 %
10.38 %
7.35 %
#N/A %
10.23 %
12/31/2015
Russell 1000 Index
1.63 %
18.58 %
15.40 %
9.93 %
10.77 %
12.55 %
12.71 %
12/31/2015
Quantitative U.S. Large Cap Environmental Equity (gross)
1.82 %
11.33 %
13.14 %
10.42 %
7.48 %
11.24 %
8.38 %
12/31/2001
Quantitative U.S. Large Cap Environmental Equity (net)
1.70 %
10.78 %
12.30 %
9.61 %
6.68 %
10.42 %
7.58 %
12/31/2001
Russell 1000 Index
1.63 %
18.58 %
15.40 %
9.93 %
10.77 %
12.55 %
8.75 %
12/31/2001
Quantitative U.S. Large Cap Low Carbon Equity (gross)
0.65 %
11.42 %
11.75 %
10.18 %
8.00 %
#N/A %
11.94 %
09/30/2013
Quantitative U.S. Large Cap Low Carbon Equity (net)
0.52 %
10.88 %
10.92 %
9.37 %
7.20 %
#N/A %
11.12 %
09/30/2013
Russell 1000 Index
1.63 %
18.58 %
15.40 %
9.93 %
10.77 %
12.55 %
12.28 %
09/30/2013
Fact Sheet
Commentary
Quantitative U.S. Large Cap Core Equity
Quantitative U.S. Large Cap Growth Equity
Quantitative U.S. Large Cap Value Equity
Quantitative U.S. Small Cap Equity
Quantitative International Equity
Quantitative U.S. Large Cap Equity 130/30
Quantitative U.S. Total Market Equity
Quantitative U.S. Long Short Equity
Responsible ESG U.S. Equity
Quantitative U.S. Large Cap Faith Based Equity
Women in Leadership U.S. Equity
Quantitative U.S. Large Cap Environmental Equity
Quantitative U.S. Large Cap Low Carbon Equity
As of 8/31/23
QTD
YTD
1 Year
3 Year
5 Year
10 Year
Since Inception
Inception Date
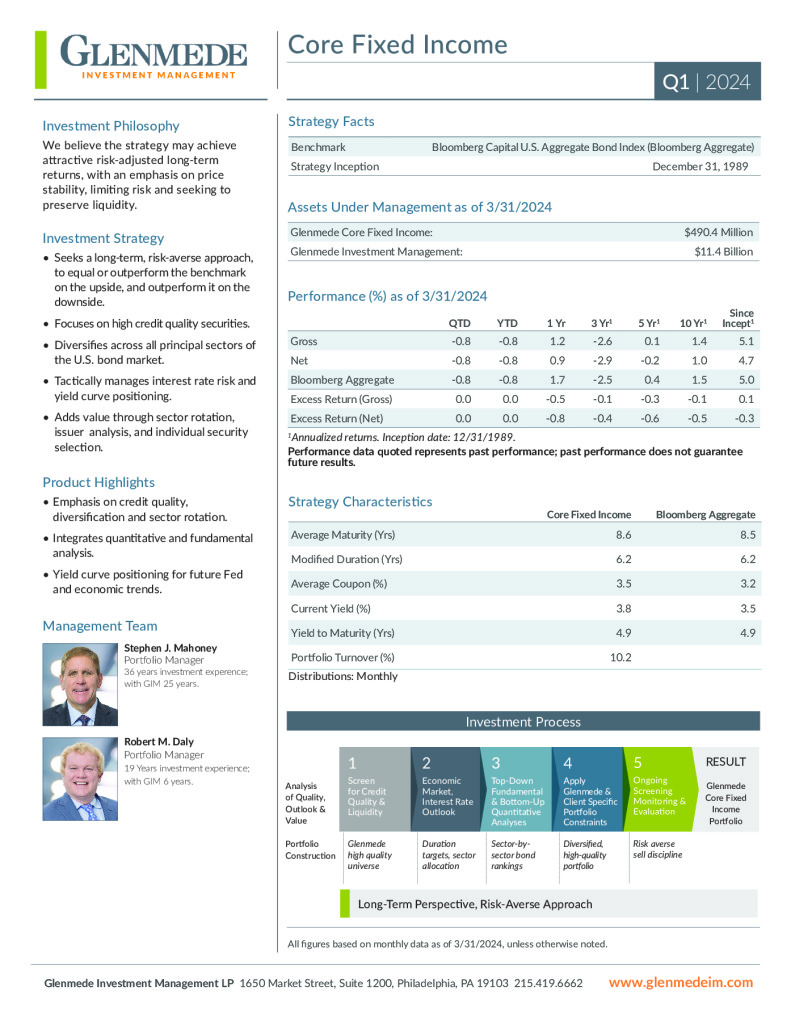
Core Fixed Income (gross)
-0.87 %
1.40 %
-1.56 %
-4.63 %
0.29 %
1.34 %
5.13 %
12/31/1989
Core Fixed Income (net)
-0.91 %
1.20 %
-1.85 %
-4.94 %
-0.07 %
0.96 %
4.72 %
12/31/1989
Bloomberg US Aggregate Index
-0.71 %
1.37 %
-1.19 %
-4.41 %
0.49 %
1.48 %
5.04 %
12/31/1989
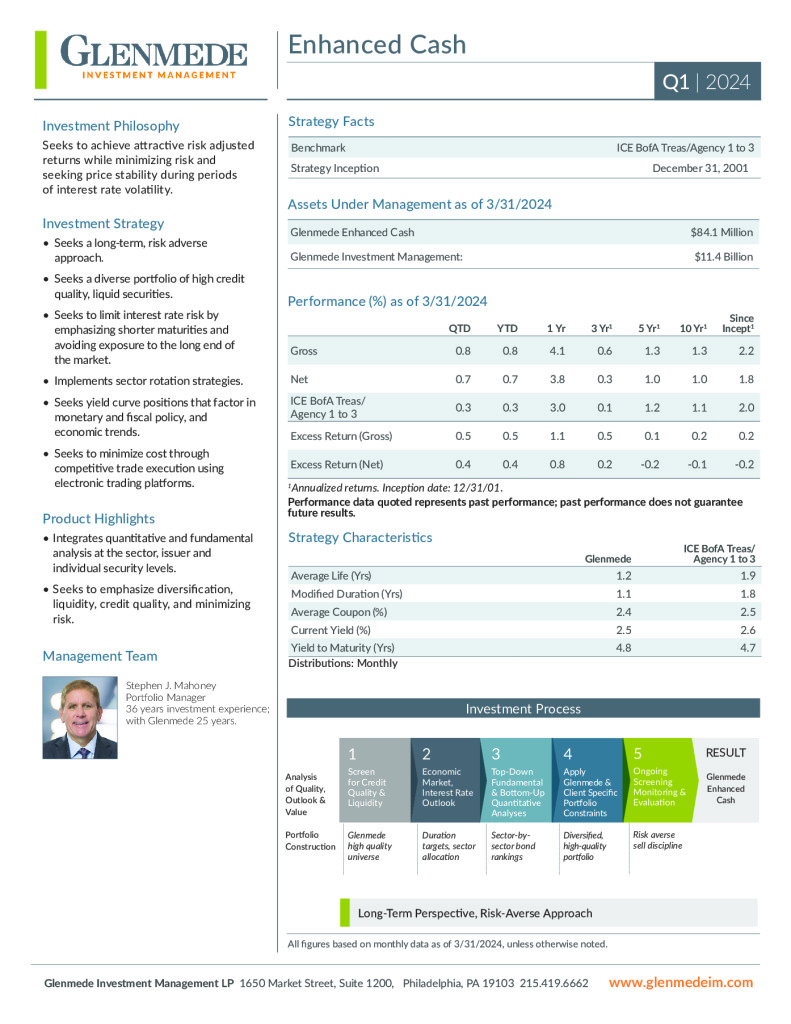
Enhanced Cash (gross)
0.79 %
2.49 %
2.36 %
-0.43 %
1.17 %
1.09 %
2.13 %
12/31/2001
Enhanced Cash (Net)
0.74 %
2.29 %
2.06 %
-0.75 %
0.82 %
0.71 %
1.73 %
12/31/2001
ICE BofA Treas/Agency 1 to 3
0.75 %
1.74 %
1.29 %
-0.82 %
1.04 %
0.84 %
1.95 %
12/31/2001
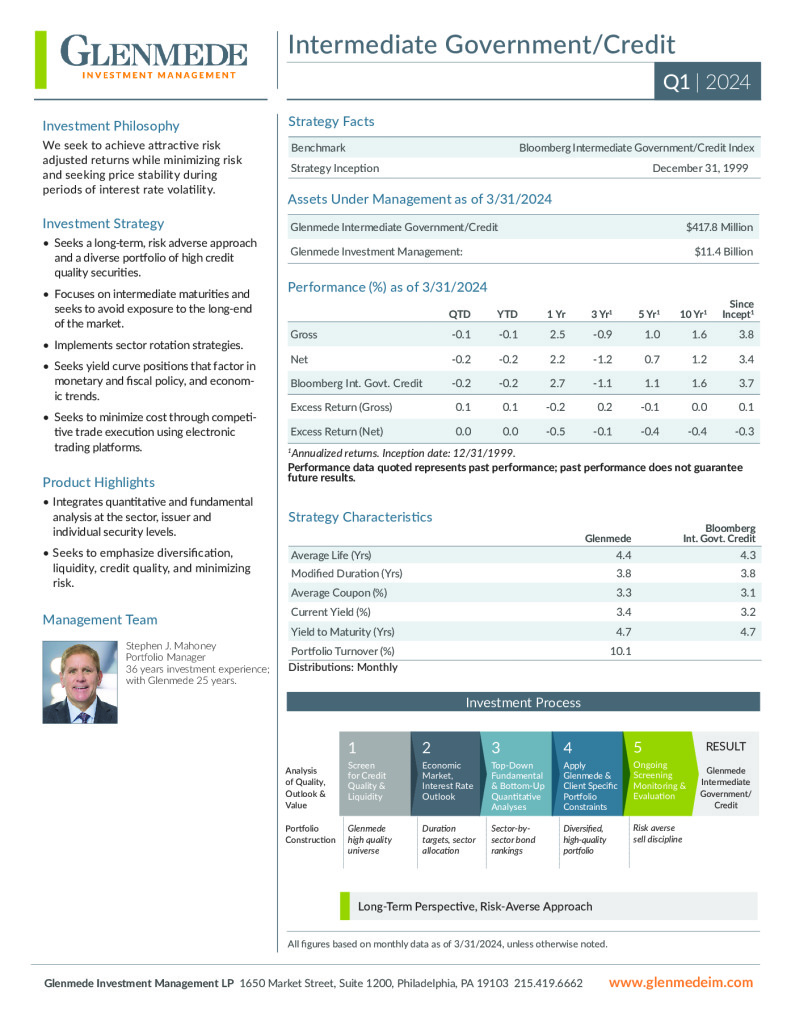
Intermediate Government Credit (Gross)
0.18 %
1.91 %
0.64 %
-2.33 %
1.15 %
1.43 %
3.74 %
12/31/1999
Intermediate Government Credit (Net)
0.13 %
1.71 %
0.33 %
-2.64 %
0.79 %
1.05 %
3.34 %
12/31/1999
Bloomberg Intermediate Government/Credit Index
0.25 %
1.75 %
0.55 %
-2.58 %
1.16 %
1.46 %
3.68 %
12/31/1999
Fact Sheet
Commentary
Core Fixed Income
Enhanced Cash
Intermediate Government/ Credit
As of 8/31/23
QTD
YTD
1 Year
3 Year
5 Year
10 Year
Since Inception
Inception Date
Secured Options (gross)
1.23 %
13.38 %
12.26 %
9.79 %
6.08 %
7.36 %
7.16 %
12/31/2003
Secured Options (Net)
1.14 %
12.97 %
11.65 %
9.15 %
5.39 %
6.62 %
6.48 %
12/31/2003
CBOE Buywrite Index
-0.10 %
10.36 %
10.12 %
8.21 %
3.41 %
6.25 %
5.33 %
12/31/2003
CBOE Putwrite Index
-0.75 %
11.64 %
12.22 %
10.99 %
5.23 %
6.89 %
6.77 %
12/31/2003
Global Secured Options (gross)
-0.02 %
12.32 %
14.49 %
8.94 %
5.60 %
#N/A %
6.41 %
04/30/2017
Global Secured Options (Net)
-0.12 %
11.92 %
13.87 %
8.31 %
4.92 %
#N/A %
5.70 %
04/30/2017
MSCI ACWI
0.76 %
14.81 %
13.95 %
7.23 %
7.46 %
8.56 %
8.64 %
04/30/2017
Fact Sheet
Commentary
Secured Options
Global Secured Options
Small Cap Equity
Small Cap Equity (gross)
As of 8/31/23
QTD
1.37 %
YTD
10.86 %
1 Year
11.36 %
3 Year
17.89 %
5 Year
7.40 %
10 Year
10.13 %
Since Inception
11.20 %
Inception Date
03/31/1991
Small Cap Equity (net)
As of 8/31/23
QTD
1.20 %
YTD
10.14 %
1 Year
10.27 %
3 Year
16.73 %
5 Year
6.34 %
10 Year
9.04 %
Since Inception
10.33 %
Inception Date
03/31/1991
Russell 2000 Index
As of 8/31/23
QTD
0.81 %
YTD
8.96 %
1 Year
4.65 %
3 Year
8.12 %
5 Year
3.14 %
10 Year
7.96 %
Since Inception
9.20 %
Inception Date
03/31/1991
Fact Sheet
Commentary
Strategic Equity
Strategic Equity (gross)
As of 8/31/23
QTD
2.92 %
YTD
16.81 %
1 Year
20.19 %
3 Year
12.27 %
5 Year
10.23 %
10 Year
12.80 %
Since Inception
9.62 %
Inception Date
03/31/2004
Strategic Equity (net)
As of 8/31/23
QTD
2.80 %
YTD
16.24 %
1 Year
19.31 %
3 Year
11.44 %
5 Year
9.42 %
10 Year
11.97 %
Since Inception
8.81 %
Inception Date
03/31/2004
S&P 500 Index
As of 8/31/23
QTD
1.57 %
YTD
18.73 %
1 Year
15.94 %
3 Year
10.52 %
5 Year
11.12 %
10 Year
12.81 %
Since Inception
9.56 %
Inception Date
03/31/2004
Fact Sheet
Commentary
Equity Income
Equity Income (gross)
As of 8/31/23
QTD
0.52 %
YTD
4.61 %
1 Year
12.05 %
3 Year
12.00 %
5 Year
9.60 %
10 Year
11.37 %
Since Inception
9.59 %
Inception Date
12/31/2004
Equity Income (net)
As of 8/31/23
QTD
0.40 %
YTD
4.09 %
1 Year
11.22 %
3 Year
11.17 %
5 Year
8.79 %
10 Year
10.55 %
Since Inception
8.78 %
Inception Date
12/31/2004
S&P 500 Index
As of 8/31/23
QTD
1.57 %
YTD
18.73 %
1 Year
15.94 %
3 Year
10.52 %
5 Year
11.12 %
10 Year
12.81 %
Since Inception
9.45 %
Inception Date
12/31/2004
Russell 1000 Value Index
As of 8/31/23
QTD
0.72 %
YTD
5.88 %
1 Year
8.59 %
3 Year
11.59 %
5 Year
7.11 %
10 Year
9.15 %
Since Inception
7.41 %
Inception Date
12/31/2004
Fact Sheet
Commentary
Quantitative U.S. Large Cap Core Equity
Quantitative U.S. Large Cap Core Equity (gross)
As of 8/31/23
QTD
1.81 %
YTD
11.44 %
1 Year
12.71 %
3 Year
10.94 %
5 Year
7.50 %
10 Year
11.53 %
Since Inception
9.59 %
Inception Date
03/31/2002
Quantitative U.S. Large Cap Core Equity (net)
As of 8/31/23
QTD
1.68 %
YTD
10.89 %
1 Year
11.88 %
3 Year
10.12 %
5 Year
6.70 %
10 Year
10.70 %
Since Inception
8.78 %
Inception Date
03/31/2002
Russell 1000 Index
As of 8/31/23
QTD
1.63 %
YTD
18.58 %
1 Year
15.40 %
3 Year
9.93 %
5 Year
10.77 %
10 Year
12.55 %
Since Inception
8.82 %
Inception Date
03/31/2002
Fact Sheet
Commentary
Quantitative U.S. Large Cap Growth Equity
Quantitative U.S. Large Cap Growth Equity (gross)
As of 8/31/23
QTD
1.37 %
YTD
16.58 %
1 Year
13.79 %
3 Year
10.38 %
5 Year
11.96 %
10 Year
14.88 %
Since Inception
12.52 %
Inception Date
12/31/2002
Quantitative U.S. Large Cap Growth Equity (Net)
As of 8/31/23
QTD
1.24 %
YTD
16.01 %
1 Year
12.95 %
3 Year
9.56 %
5 Year
11.13 %
10 Year
14.03 %
Since Inception
11.69 %
Inception Date
12/31/2002
Russell 1000 Growth Index
As of 8/31/23
QTD
2.44 %
YTD
32.17 %
1 Year
21.94 %
3 Year
8.25 %
5 Year
13.81 %
10 Year
15.63 %
Since Inception
11.90 %
Inception Date
12/31/2002
Fact Sheet
Commentary
Quantitative U.S. Large Cap Value Equity
Quantitative U.S. Large Cap Value Equity (gross)
As of 8/31/23
QTD
1.64 %
YTD
4.22 %
1 Year
7.90 %
3 Year
13.93 %
5 Year
6.64 %
10 Year
#N/A %
Since Inception
8.21 %
Inception Date
04/30/2015
Quantitative U.S. Large Cap Value Equity (net)
As of 8/31/23
QTD
1.52 %
YTD
3.71 %
1 Year
7.10 %
3 Year
13.09 %
5 Year
5.85 %
10 Year
#N/A %
Since Inception
7.41 %
Inception Date
04/30/2015
Russell 1000 Value Index
As of 8/31/23
QTD
0.72 %
YTD
5.88 %
1 Year
8.59 %
3 Year
11.59 %
5 Year
7.11 %
10 Year
9.15 %
Since Inception
7.81 %
Inception Date
04/30/2015
Fact Sheet
Commentary
Quantitative U.S. Small Cap Equity
Quantitative U.S. Small Cap Equity (gross)
As of 8/31/23
QTD
2.95 %
YTD
8.77 %
1 Year
11.07 %
3 Year
17.80 %
5 Year
7.30 %
10 Year
#N/A %
Since Inception
8.56 %
Inception Date
11/30/2017
Quantitative U.S. Small Cap Equity (net)
As of 8/31/23
QTD
2.78 %
YTD
8.05 %
1 Year
9.97 %
3 Year
16.64 %
5 Year
6.31 %
10 Year
#N/A %
Since Inception
7.58 %
Inception Date
11/30/2017
Russell 2000 Index
As of 8/31/23
QTD
0.81 %
YTD
8.96 %
1 Year
4.65 %
3 Year
8.12 %
5 Year
3.14 %
10 Year
7.96 %
Since Inception
5.06 %
Inception Date
11/30/2017
Fact Sheet
Commentary
Quantitative International Equity
Quantitative International Equity (Gross)
As of 8/31/23
QTD
-0.02 %
YTD
14.44 %
1 Year
22.53 %
3 Year
8.54 %
5 Year
4.02 %
10 Year
4.63 %
Since Inception
6.78 %
Inception Date
11/30/1988
Quantitative International Equity (Net)
As of 8/31/23
QTD
-0.14 %
YTD
13.88 %
1 Year
21.63 %
3 Year
7.74 %
5 Year
3.24 %
10 Year
3.81 %
Since Inception
6.19 %
Inception Date
11/30/1988
MSCI World ex US Index
As of 8/31/23
QTD
-0.76 %
YTD
10.45 %
1 Year
16.45 %
3 Year
6.28 %
5 Year
4.31 %
10 Year
4.91 %
Since Inception
4.77 %
Inception Date
11/30/1988
Fact Sheet
Commentary
Quantitative U.S. Large Cap Equity 130/30
Quantitative U.S. Large Cap 130/ 30 Equity (gross)
As of 8/31/23
QTD
0.35 %
YTD
3.01 %
1 Year
6.30 %
3 Year
11.18 %
5 Year
6.58 %
10 Year
10.81 %
Since Inception
9.27 %
Inception Date
12/31/2005
Quantitative U.S. Large Cap 130/ 30 Equity (net)
As of 8/31/23
QTD
0.18 %
YTD
2.33 %
1 Year
5.25 %
3 Year
10.09 %
5 Year
5.57 %
10 Year
9.87 %
Since Inception
8.40 %
Inception Date
12/31/2005
Russell 1000 Index
As of 8/31/23
QTD
1.63 %
YTD
18.58 %
1 Year
15.40 %
3 Year
9.93 %
5 Year
10.77 %
10 Year
12.55 %
Since Inception
9.68 %
Inception Date
12/31/2005
Fact Sheet
Commentary
Quantitative U.S. Total Market Equity
Quantitative U.S. Total Market Equity (gross)
As of 8/31/23
QTD
0.65 %
YTD
9.23 %
1 Year
10.60 %
3 Year
17.70 %
5 Year
8.58 %
10 Year
12.17 %
Since Inception
8.87 %
Inception Date
12/31/2006
Quantitative U.S. Total Market Equity (net)
As of 8/31/23
QTD
0.48 %
YTD
8.51 %
1 Year
9.51 %
3 Year
16.36 %
5 Year
7.28 %
10 Year
10.82 %
Since Inception
7.55 %
Inception Date
12/31/2006
Russell 3000 Index
As of 8/31/23
QTD
1.59 %
YTD
18.01 %
1 Year
14.76 %
3 Year
9.81 %
5 Year
10.25 %
10 Year
12.23 %
Since Inception
9.17 %
Inception Date
12/31/2006
Fact Sheet
Commentary
Quantitative U.S. Long Short Equity
Quantitative U.S. Long/Short Equity (gross)
As of 8/31/23
QTD
1.92 %
YTD
5.48 %
1 Year
9.36 %
3 Year
10.91 %
5 Year
3.68 %
10 Year
5.13 %
Since Inception
4.02 %
Inception Date
11/30/2006
Quantitative U.S. Long/Short Equity (net)
As of 8/31/23
QTD
1.71 %
YTD
4.61 %
1 Year
8.02 %
3 Year
9.55 %
5 Year
2.40 %
10 Year
3.84 %
Since Inception
2.74 %
Inception Date
11/30/2006
Russell 3000 Index
As of 8/31/23
QTD
1.59 %
YTD
18.01 %
1 Year
14.76 %
3 Year
9.81 %
5 Year
10.25 %
10 Year
12.23 %
Since Inception
9.20 %
Inception Date
11/30/2006
70 FTSE 3-Month U.S. T-Bill/ 30 Russell 3000
As of 8/31/23
QTD
0.92 %
YTD
3.33 %
1 Year
4.44 %
3 Year
1.63 %
5 Year
1.68 %
10 Year
1.07 %
Since Inception
1.08 %
Inception Date
11/30/2006
Fact Sheet
Commentary
Responsible ESG U.S. Equity
Responsible ESG U.S. Equity (gross)
As of 8/31/23
QTD
1.74 %
YTD
9.15 %
1 Year
11.02 %
3 Year
10.90 %
5 Year
7.97 %
10 Year
#N/A %
Since Inception
11.70 %
Inception Date
12/31/2015
Responsible ESG U.S. Equity (net)
As of 8/31/23
QTD
1.61 %
YTD
8.61 %
1 Year
10.20 %
3 Year
10.08 %
5 Year
7.17 %
10 Year
#N/A %
Since Inception
10.88 %
Inception Date
12/31/2015
Russell 1000 Index
As of 8/31/23
QTD
1.63 %
YTD
18.58 %
1 Year
15.40 %
3 Year
9.93 %
5 Year
10.77 %
10 Year
12.55 %
Since Inception
12.71 %
Inception Date
12/31/2015
Fact Sheet
Commentary