Concentration Traps of Equity Indexing
It has been over 20 years since the peak of the internet bubble in March 2000. However, capital markets continue to experience irrational periods, including the rise of financial companies in the mid-2000’s, the resurgence of technology and internet related stocks (e.g., Apple, Microsoft, Amazon, Alphabet, Meta, Tesla) from 2018 through 2020, and more recently the excitement of Bitcoin and Artificial Intelligence (AI). Subjective investor behavior and greed can lead to stock mispricings which can distort their weightings in equity indexes.
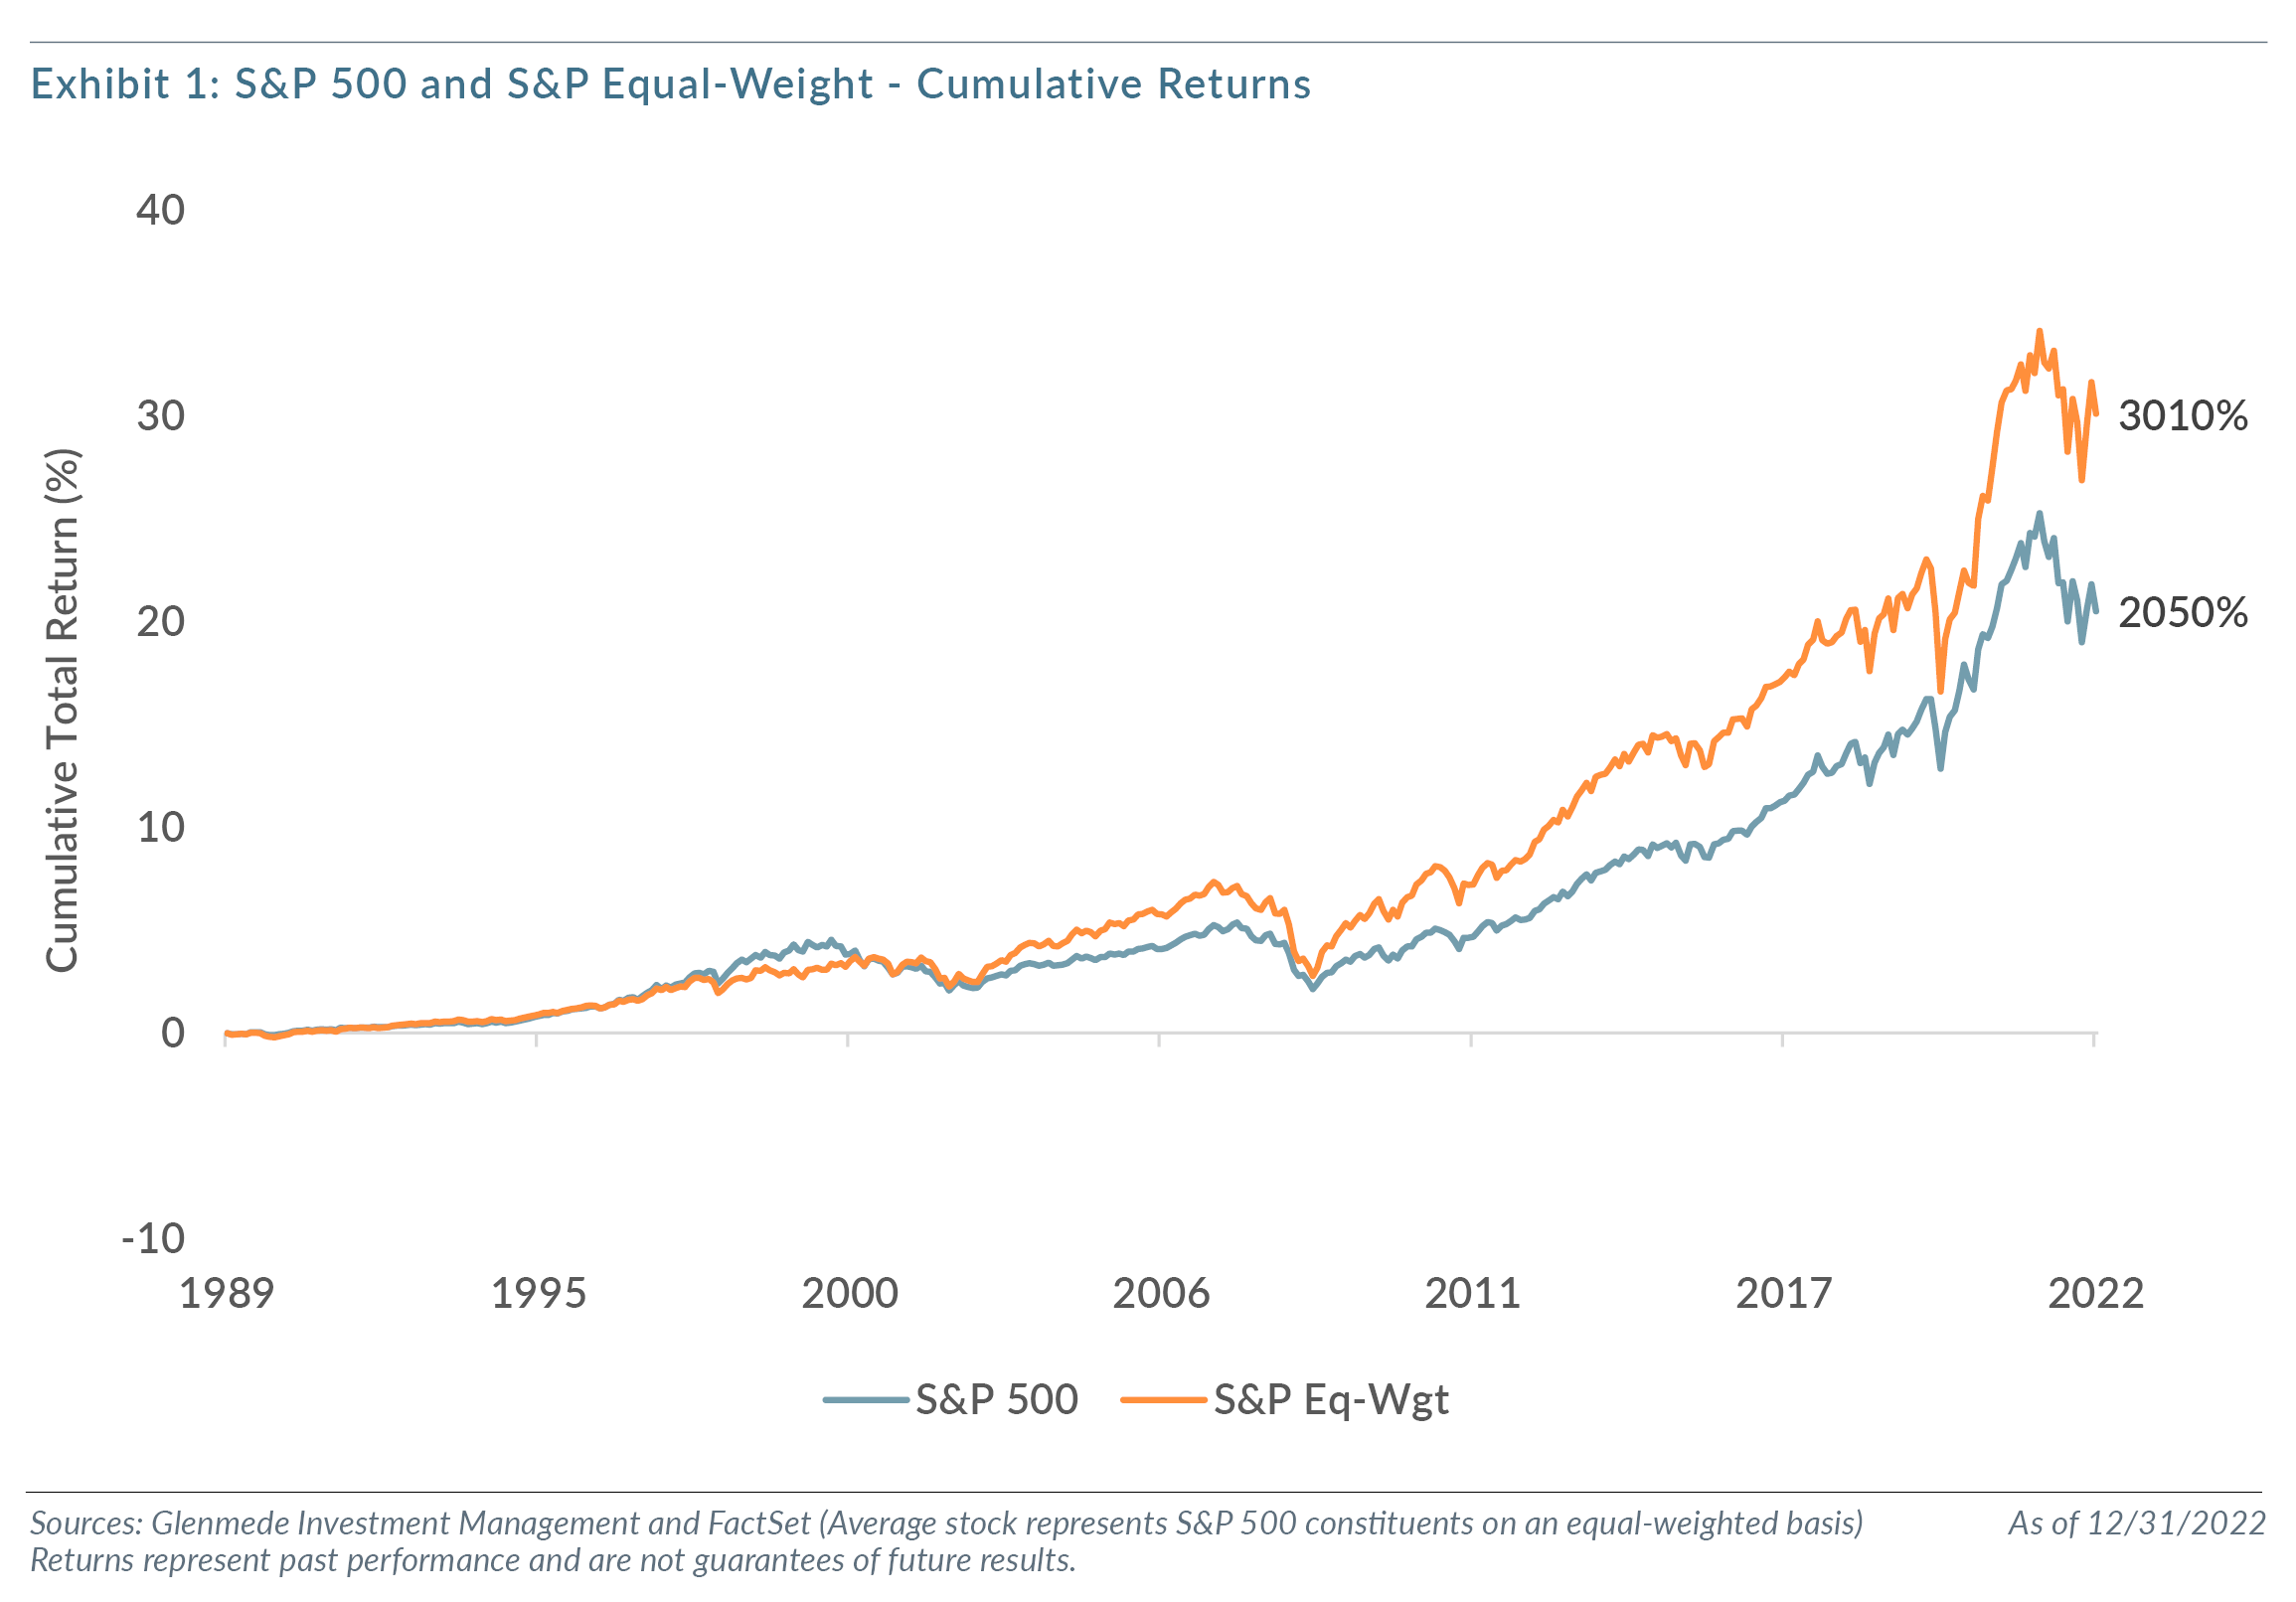
Over time, though, valuation and earnings matter to performance over market cycles. The S&P 500, where stocks are weighted based on their market capitalization, had a cumulative total return of 2050% (9.7% annualized) from 1990 through 2022. A portfolio consisting of all 500 companies in the index on an equal-weighted basis (.2% weighting in each stock) would have experienced a cumulative total return of about 3010% (11.0% annualized).
This inconsistency in performance of stock indexes versus the average stock reflects the common index methodology of weighting stocks by market capitalization. Companies that have larger market capitalizations get a greater weighting in the index. Although market capitalization-based indexes represent a reasonable measure of the overall stock market’s performance, there are significant risks that investors should consider when investing in market index funds.
Market Index Funds Are Subject to “Irrational Exuberance”
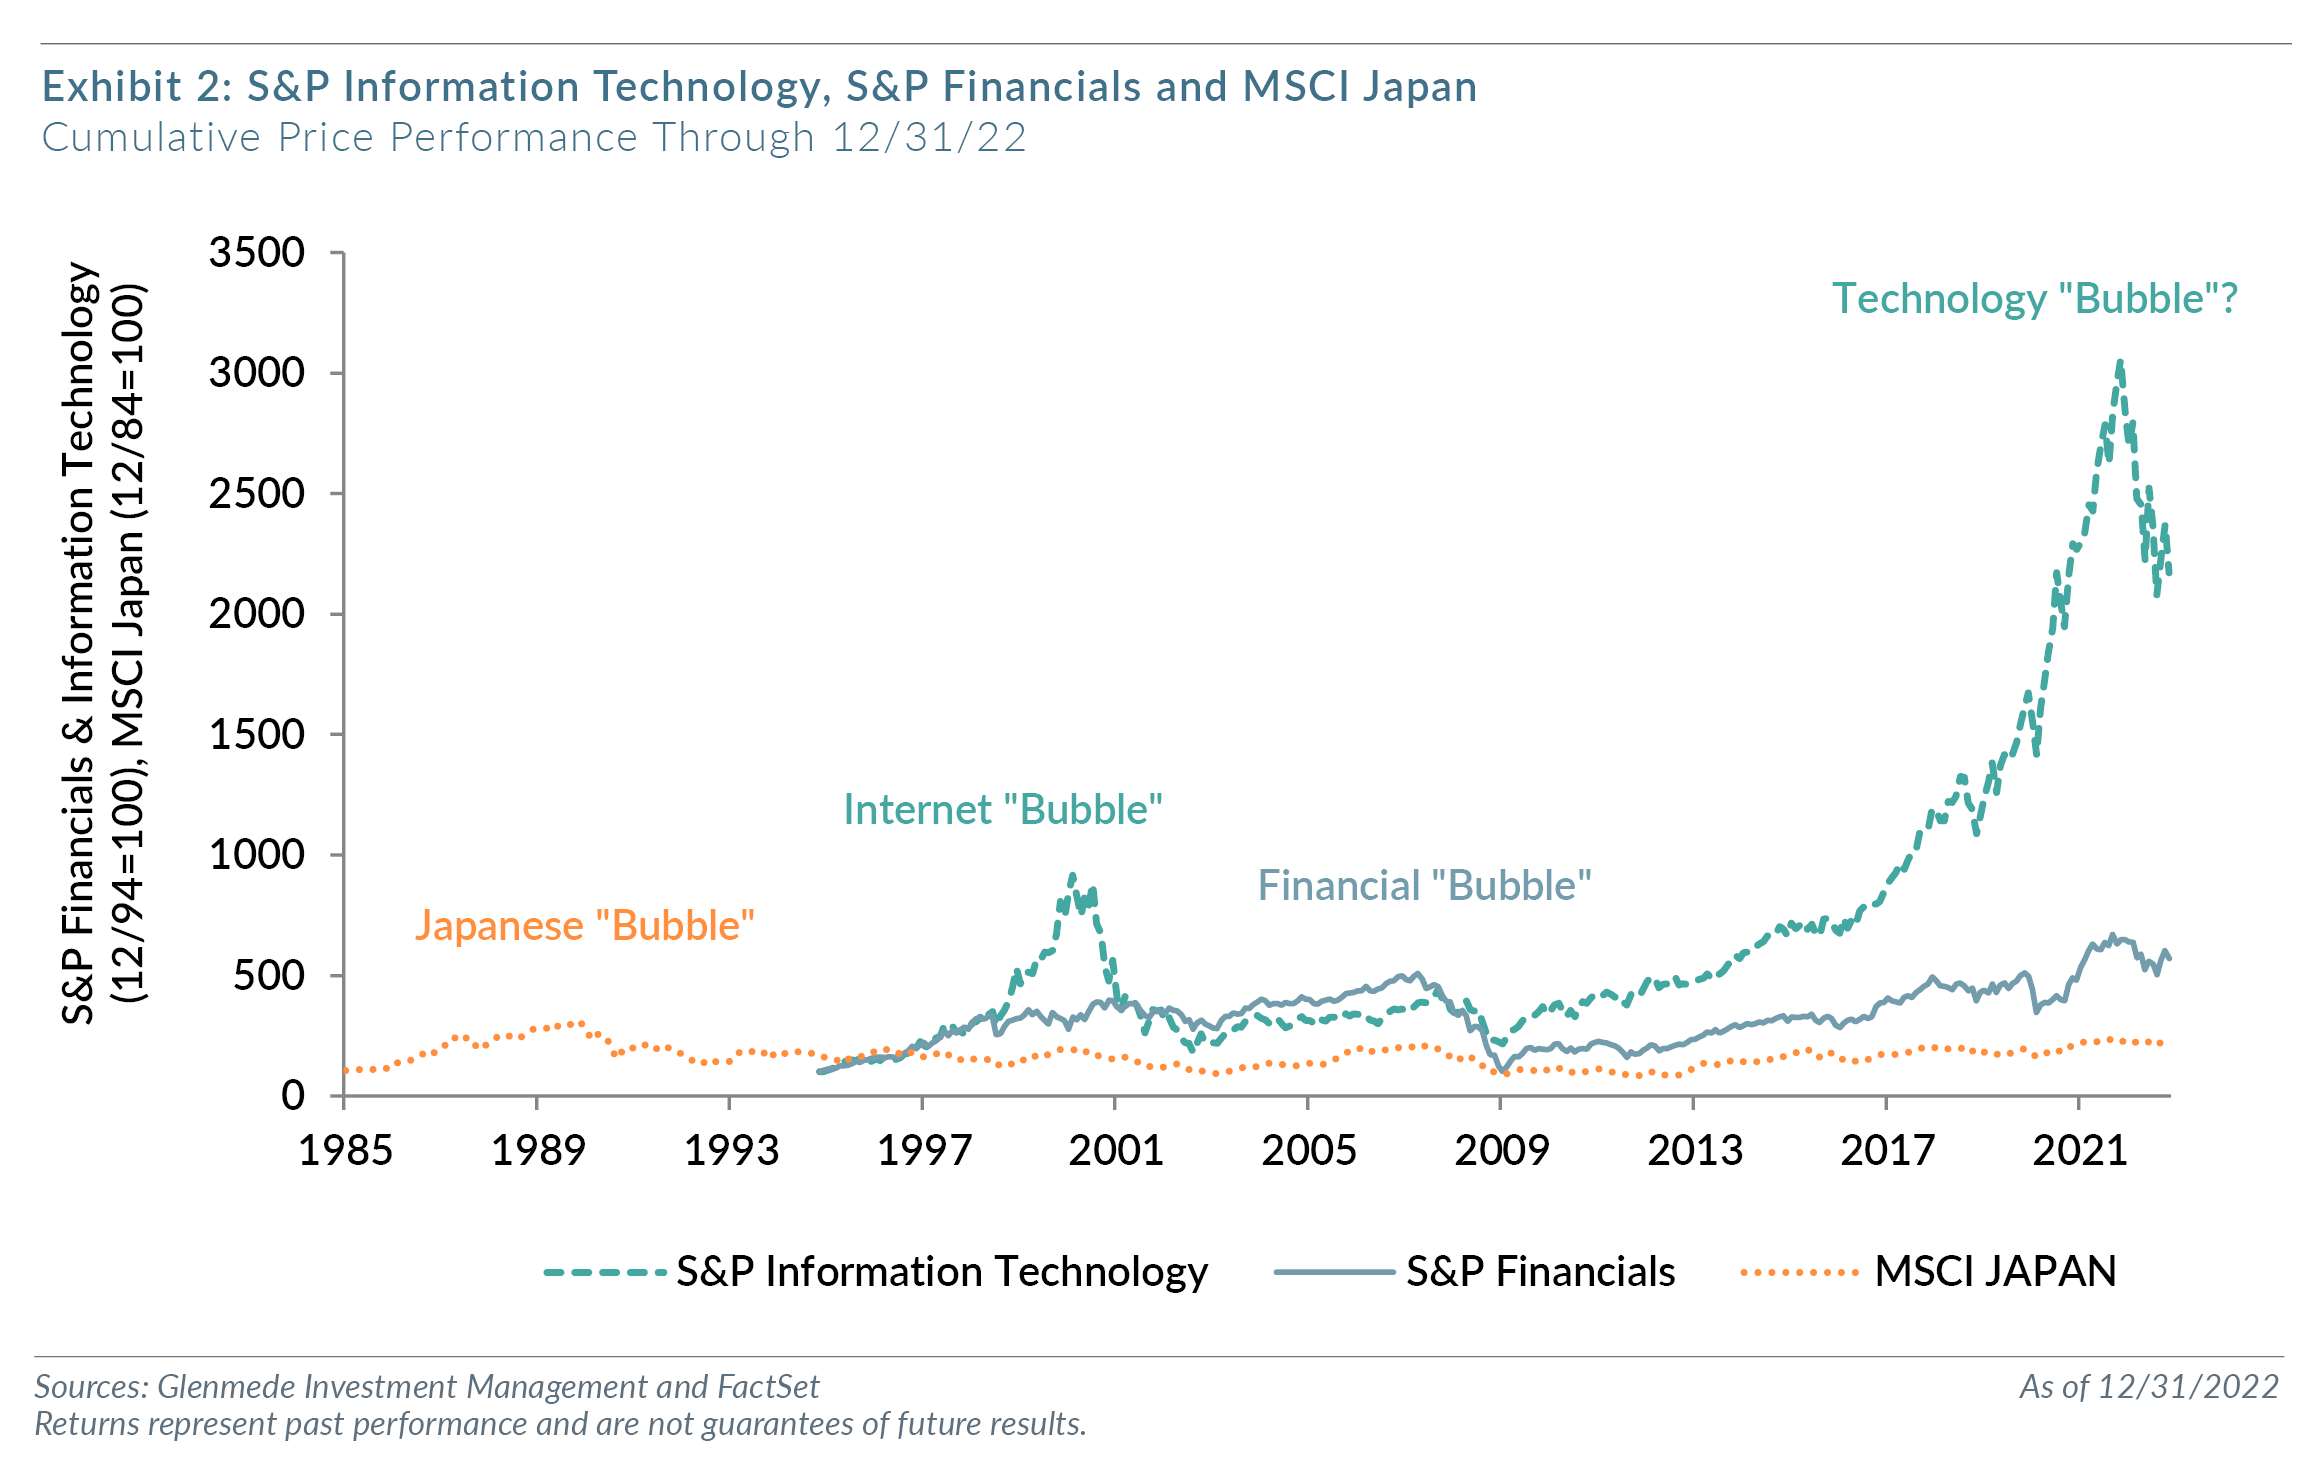
Indexing is most successful in an equity market with efficient and rational pricing. However, stock markets are not always rational (recall Alan Greenspan’s “Irrational Exuberance” speech of December 5, 1996). Human investors are influenced by greed, fear of losing, rumors, herd following, or the latest investment “fads.” This irrational behavior can manifest itself in the equity markets to produce overvaluations of specific stocks, sectors or the overall market, which eventually lead to corrections or crashes. History provides numerous examples in this regard: the tulip bulb speculation of the 1600’s, the roaring 20’s followed by the stock market crash of October 1929, the “Nifty 50” of the 1970’s, and more recently the Japanese “Bubble” of the 1980’s, the Internet “Bubble” of the 1990’s, the Financial “Bubble” of the 2000’s, and the latest run of large technology stocks (Exhibit 2).
It is difficult to believe that investors were rational in the bidding up of internet-related stocks (with little or no earnings) to their stratospheric prices in early 2000. The rising prices of technology and internet-related stocks had a significant effect in boosting the performance of market index funds relative to rational portfolio managers during this period. For the three years ending August 2020, investors boosted share prices of technology and internet-related stocks above levels reached in March 2000. During this time, only five companies (Apple, Alphabet, Amazon, Facebook and Microsoft) accounted for about half (49%) of the S&P 500 performance with an average annualized return of over 40%. In comparison, the average stock in the S&P 500 Index had a total return of about 5.6%. As of August 31, 2020, these five companies represented about a 24% weighting in the S&P 500 Index. Subsequently, from August 31, 2020 through December 31, 2022, these five stocks had a combined return of about -5.3% versus +12.8% for the average stock in the S&P 500 Equal-Weight Index. In the future, we would expect that the stock markets will continue to be subject to “irrational exuberance” and that an experienced active manager can reward an investor with an equity portfolio of reasonable valuations and potentially less downside risk.
Index Funds Favor Stocks with the Largest Market Capitalizations
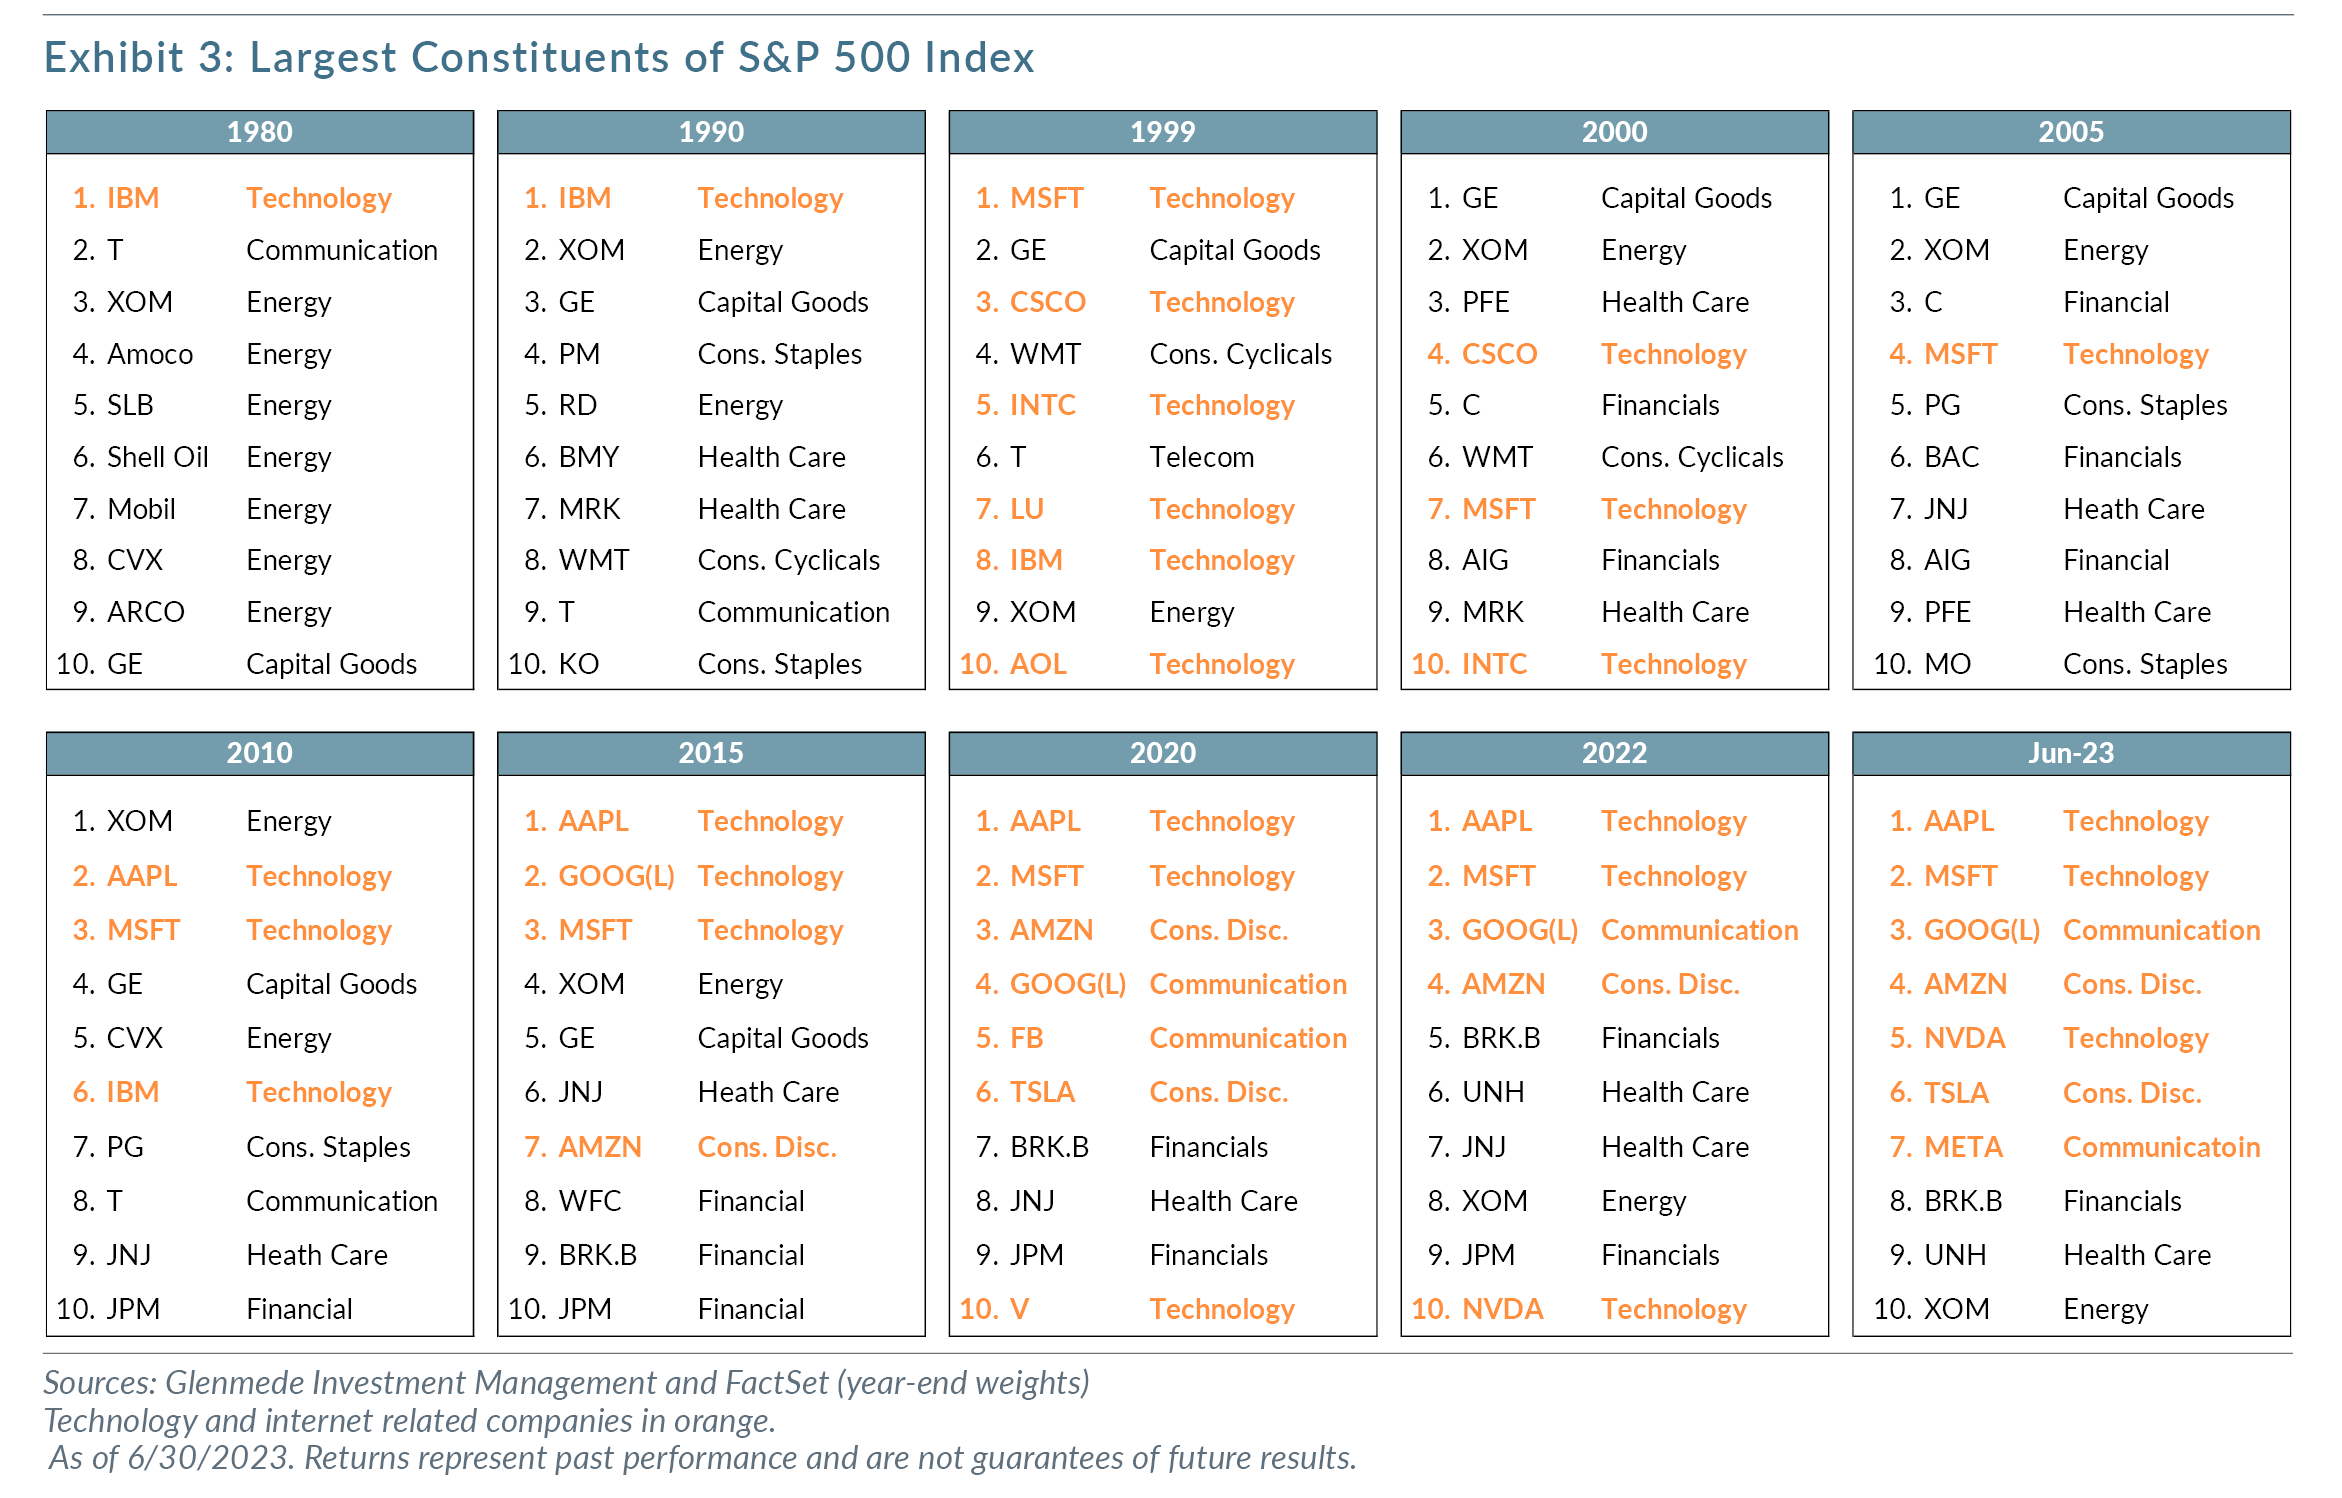
Stocks with the highest market capitalizations have the greatest weights in market index funds. But will they continue to outperform smaller companies in the future? It would seem difficult to rationalize that the future earnings growth of these huge companies can continue in perpetuity to outpace others to justify their overweight in benchmark indexes. Theoretically, there should be a point in time when a company’s earnings growth rate will slow as its products and services approach a certain level of market saturation, or they become subject to increasing competitive pressures. Some companies may also become so big that their market dominance can lead to increased regulatory scrutiny and anti-trust pressures. A historical review of the ten largest stocks in the S&P 500 Index suggests that few companies can consistently maintain their relative top ten ranking for an extended time (Exhibit 3). For example, only three of the ten largest stocks from December 2000 remained in the top ten as of December 2010. As for technology/internet related stocks, they accounted for six of the top ten as of December 1999, only one of the top ten as of December 2005, seven of the top ten in December 2020 and five of the top ten as of December 2022. Despite this high turnover, a market index fund will always overweight the prevailing top ten relative to other stocks.
Indexing can have Volatile Sector Weightings
At the peak of the internet bubble in early March 2000, information technology and communication services stocks represented more than 36% of the market capitalization of the S&P 500. The broader market indexes like the Wilshire 5000 also reflected similar weightings in these sectors by including high flying smaller internet companies. As a result, investors in market cap-based index funds owned more volatile equity portfolios with potentially greater downside risk exposures. In the subsequent three years, index fund investors suffered from the decline in technology/communications stocks to less than a 20% share of the S&P 500 as of year-end 2002. Exhibit 4 depicts the fluctuation of S&P 500 sector weightings since 1990. From 2017 to 2021, investors herded into information technology and communication services stocks with their combined sector weights surging to over 36% of the index before declining to under 30% by year-end 2022.
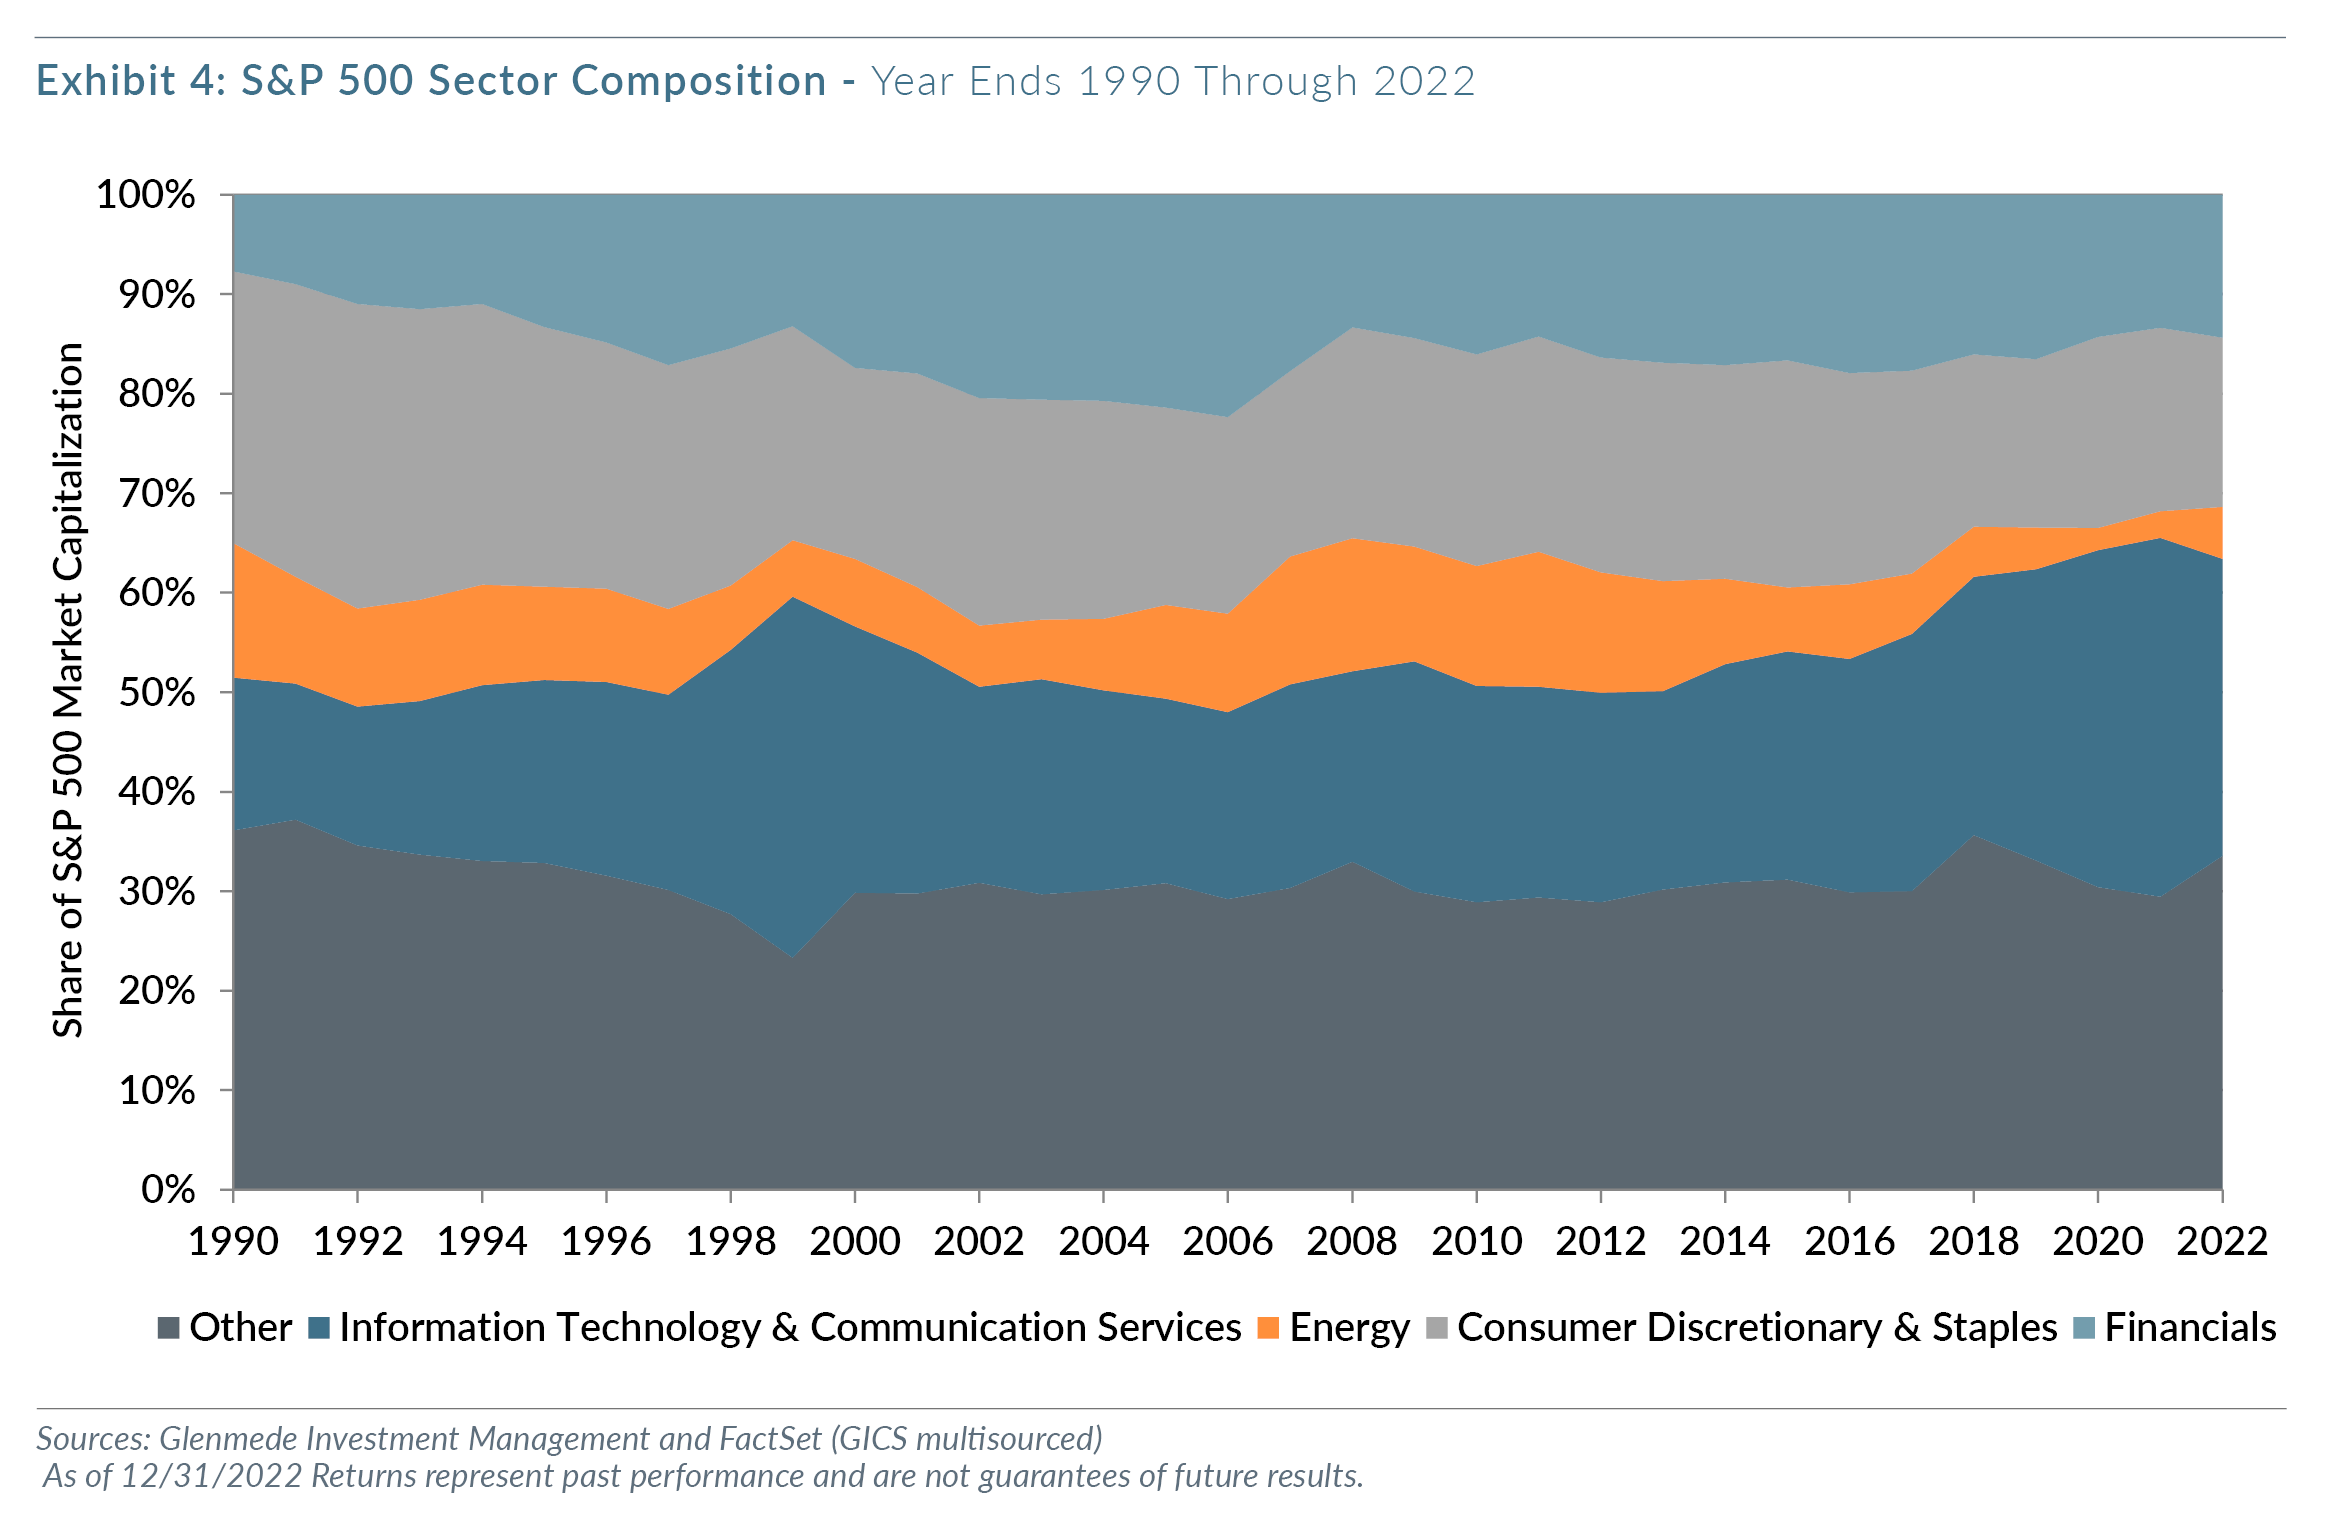
Overall, the chart highlights the volatility of sector weights in market cap indexes over time. An index portfolio is subject to changes in its return and risk characteristics because of variations in sector concentrations. These changes may not be consistent with the client’s return and risk objectives. An active manager, by controlling sector exposures in context with the client’s overall asset mix, can improve the likelihood of achieving long-term investment objectives. Ideally, the portfolio manager should rebalance asset classes as well as sector exposures to maintain the consistency of the overall portfolio’s return and risk characteristics.
Excessive Indexing Can Lead To Inefficient Stock Prices
Investors’ appetite for index funds has grown significantly over the past 25 years. The growth in index funds had been supported by their strong performance in the late 1990s. The S&P 500 Index achieved five consecutive years of 20%+ returns and outperformed most active equity managers. The superior performance of index funds was reflective of their inherent bias towards large cap growth stocks which outperformed value and smaller cap stocks during this period.
As index-based mutual funds and exchange-traded funds (ETFs) continue to gain in popularity and active managers are increasingly pressured to control their performance tracking error relative to benchmark indexes, the equity market could become less efficient and potentially subject to increased risks.
The massive flows in and out of ETFs and index-related instruments appeared to have had a significant impact on the behavior of stock prices. Frequently, stocks seemed to be trading less on news related to the specific company and more on liquidity and shares outstanding. The impact of ETF flows on stock prices appeared particularly pronounced in less liquid, small and micro-cap stocks.
Equity markets can only be efficient when active investors continually adjust security prices based on new information. As the proportion of passively managed equities increases, a smaller percentage of company shares becomes actively managed. The continuation of this trend in the future should potentially benefit active portfolio managers by creating more stock price inefficiencies to exploit.
Summary
Since their introduction, equity index funds have given individual investors the opportunity to invest in a diversified equity portfolio at low cost. Additionally, the strong returns of large cap growth stocks had propelled index funds to outperform many active equity managers in the 1990s and 2017 to 2020. As a result, there has been constructive pressure on active managers to lower management fees and transaction costs to remain competitive with the index funds. Many active portfolio managers have responded to the challenge by reducing fees, controlling turnover and implementing tax sensitive strategies.
Market cap-weighted index funds reflect several risks to the investor, including irrational market behavior, equity pricing inefficiencies, the index’s greater weightings to the largest companies, and sector volatility. An experienced active manager can effectively reduce some of these risks with quantitative tools, a valuation discipline, fundamental research, and portfolio optimization techniques. The portfolio manager can prudently select equities to create a portfolio that is appropriate for the client, and not own a stock just because it is a member of an index. The characteristics of an equity portfolio can be customized to complement the client’s overall asset allocation mix in meeting long-term return and risk objectives. In addition, the active manager can manage the individual equity holdings to reduce the investor’s tax burden. A discretionary equity portfolio can also reflect a client’s preferences for socially responsible or environmentally sensitive companies. In the future, these advantages should allow an experienced equity manager to reward the investor with higher returns and/or lower downside risk versus market index funds.
The author, Vladimir de Vassal, CFA, is a portfolio manager for Glenmede Investment Management LP. He would like to thank Alex Atanasiu, Paul Sullivan, Jake Adamcik, David Marcucci and Ruohao Chen for their contributions and support.
Views expressed include opinions of the portfolio managers as of April 30, 2023, based on the facts then available to them. All facts are gathered in good faith from public sources, but accuracy is not guaranteed. Opinions may change based on further evidence without notice to you. Nothing herein is intended as a recommendation of any security, sector, product or service. Returns of indexes do not reflect actual returns to investors; rather they are intended to reflect how particular segments of the market perform. Among other things, these results omit fees related to investment management and trading, which would lower returns. The data herein includes past performance and such performance figures are not guarantees of future results. Actual performance in a given account may be lower or higher than what is set forth above. All investment has risk, including risk of loss. Designed for professional client and adviser use only.
The S&P 500 Index consists of 500 widely held common stocks. The unmanaged index is a total return index with dividends reinvested. The Russell 1000 Index is an unmanaged, market value weighted index, which measures performance of the largest 1,000 companies in the U.S equity market. The S&P 400 MidCap Index is comprised of 400 companies that broadly represent companies with midrange market capitalization between $3.6 billion and $13.1 billion. The MSCI EAFE Growth Index captures large and mid cap securities exhibiting overall growth style characteristics across Developed Markets countries around the world, excluding the US and Canada. The MSCI EAFE Value Index captures large and mid cap securities exhibiting overall value style characteristics across Developed Markets countries around the world, excluding the US and Canada. The MSCI Japan Index is designed to measure the performance of the large and mid cap segments of the Japanese market. One cannot invest directly in an index.
Suggested Readings
DeBondt, W.F.M. and R. Thaler. “Does the Stock Market Overreact?” Journal of Finance 40, no. 3 (1985): 793-805.
Kahneman, D. and M.W. Riepke. “Aspects of Investor Psychology.” Journal of Portfolio Management 24, no. 4 (1998): 52-65.
Gordon, J.S. The Great Game (New York: Scribner, 1999).
Patterson, S. The Quants (New York: Crown Business, 2010).
CFTC and SEC. Findings Regarding the Market Events of May 6, 2010 (September 30, 2010), www.sec.gov/news/studies/2010/marketevents-report.pdf