Thought Leadership
 Insights
April 01, 2026
Insights
April 01, 2026
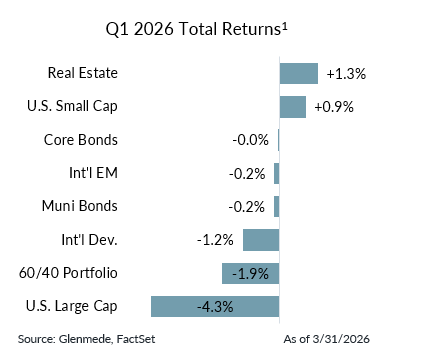
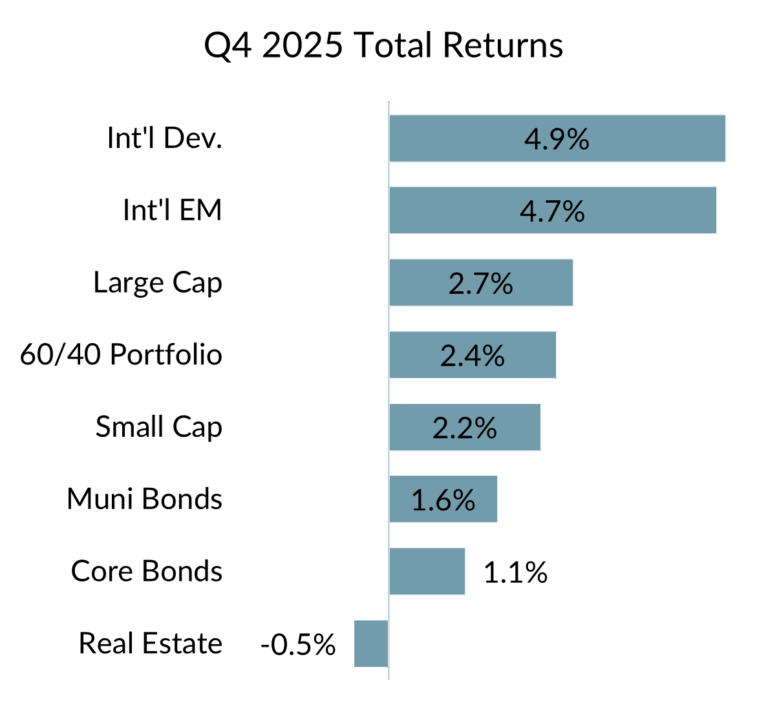
Executive Summary: Geopolitical tensions, particularly the escalation in Iran, introduced a new source of uncertainty, though economic data remained broadly constructive with some modest signs of softening …
 News
March 16, 2026
News
March 16, 2026
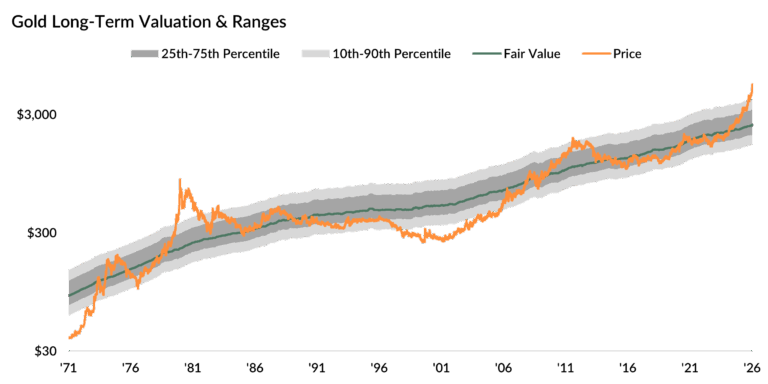
Gold has long maintained a distinctive role in diversified portfolios. Historically, it has functioned as a form of “insurance” by serving as a store of value, offering …
 Insights
March 02, 2026
Insights
March 02, 2026
Over the weekend, negotiations between the U.S. and Iran evolved into a broader Middle Eastern military conflict. News reports state that coordinated U.S. and Israeli military operations …
 News
February 20, 2026
News
February 20, 2026
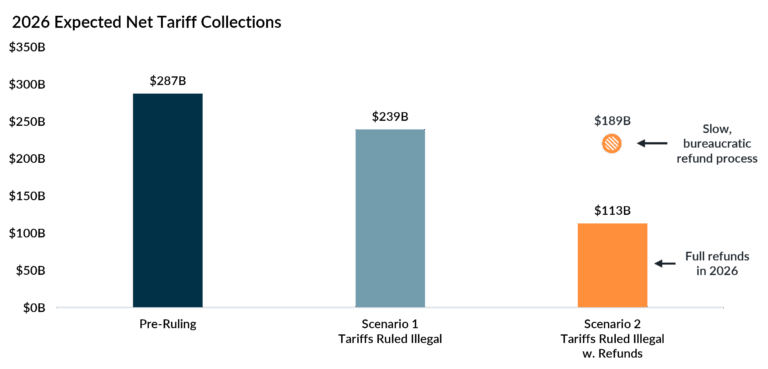
The Supreme Court has ruled that tariffs imposed under the International Emergency Economic Powers Act (IEEPA) were unlawful, concluding that the executive branch exceeded its authority and …
 Insights
February 03, 2026
Insights
February 03, 2026
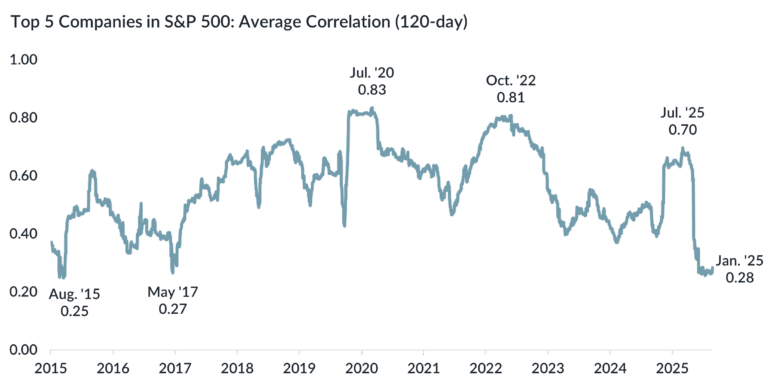
For much of the past decade, leadership among the largest stocks in the S&P 500 has been defined not only by outsized returns, but also by remarkable …
 Insights
January 05, 2026
Insights
January 05, 2026
Executive Summary: The U.S. economy showed signs of continued resilience, even as government data disruptions and lingering policy uncertainty limited confidence in major economic indicators. As Congress …
 Insights
November 19, 2025
Insights
November 19, 2025
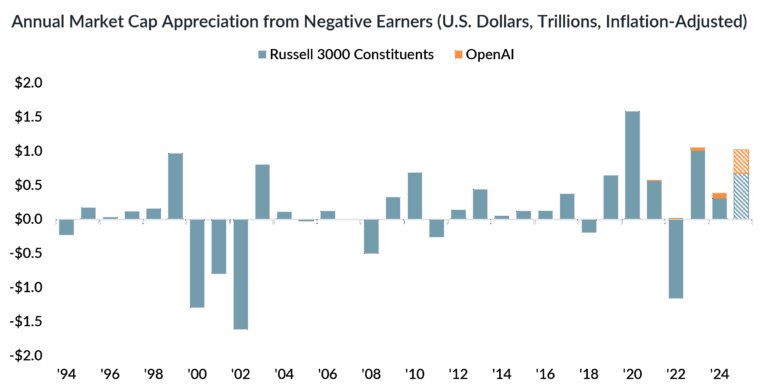
Negative-earning companies in the Russell 3000 have contributed meaningfully to total market cap gains in five of the last six full calendar years. If the first 10 …
 Insights
November 05, 2025
Insights
November 05, 2025
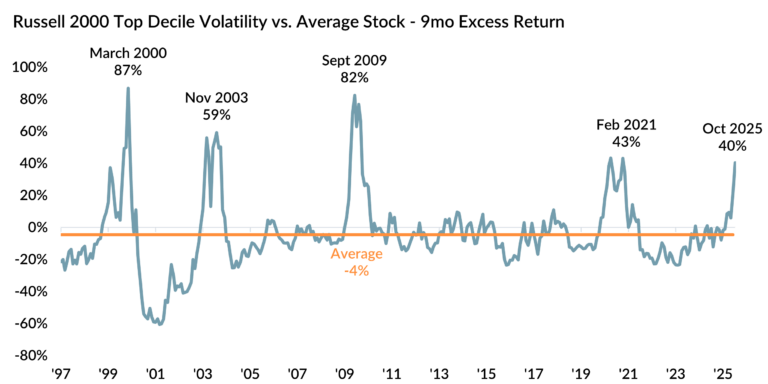
Ever since the calendar flipped to the second half of 2025, small caps have performed well relative to their larger counterparts. The Russell 2000’s 14.7% total return …
 News
November 04, 2025
News
November 04, 2025
The actively managed equity portfolio offers investors access to today’s energy transition landscape PHILADELPHIA, November 4, 2025 — Glenmede Investment Management (GIM), an independently owned boutique asset …
 Insights
October 20, 2025
Insights
October 20, 2025
Energy demand is rising, driven by artificial intelligence, electrification, and industrial reshoring, which are raising supply-demand imbalance and price risk. Past energy demand shifts were triggered by …