Why Profitability Matters: Positive Versus Negative Earners
In fall 2020, we examined the composition of the Russell 2000 Index and noted the extended percentage of negative earners in the benchmark and the outsized returns the cohort had exerted. Our analysis suggested that periods of negative earner outperformance tended to be episodic in nature rather than persistent. We suggested that periods in which negative earners saw significant share price appreciation typically were resolved through share price deterioration.
In this article, we re-examine the evidence to see if our thesis proved correct over the ensuing 15 months. We also look at the current valuation of small caps and consider the potential behavioral implications that typically emerge during investment regime changes.
A successful strategy
Investing in companies with positive earnings has been a successful strategy versus investing in companies with negative earnings. The chart in Exhibit 1 captures the longest available history for which we have usable data for the Russell 2000 Index. Not only have stocks with positive earnings provided a superior total return, but they also have done so with less risk than those stocks with negative earnings.
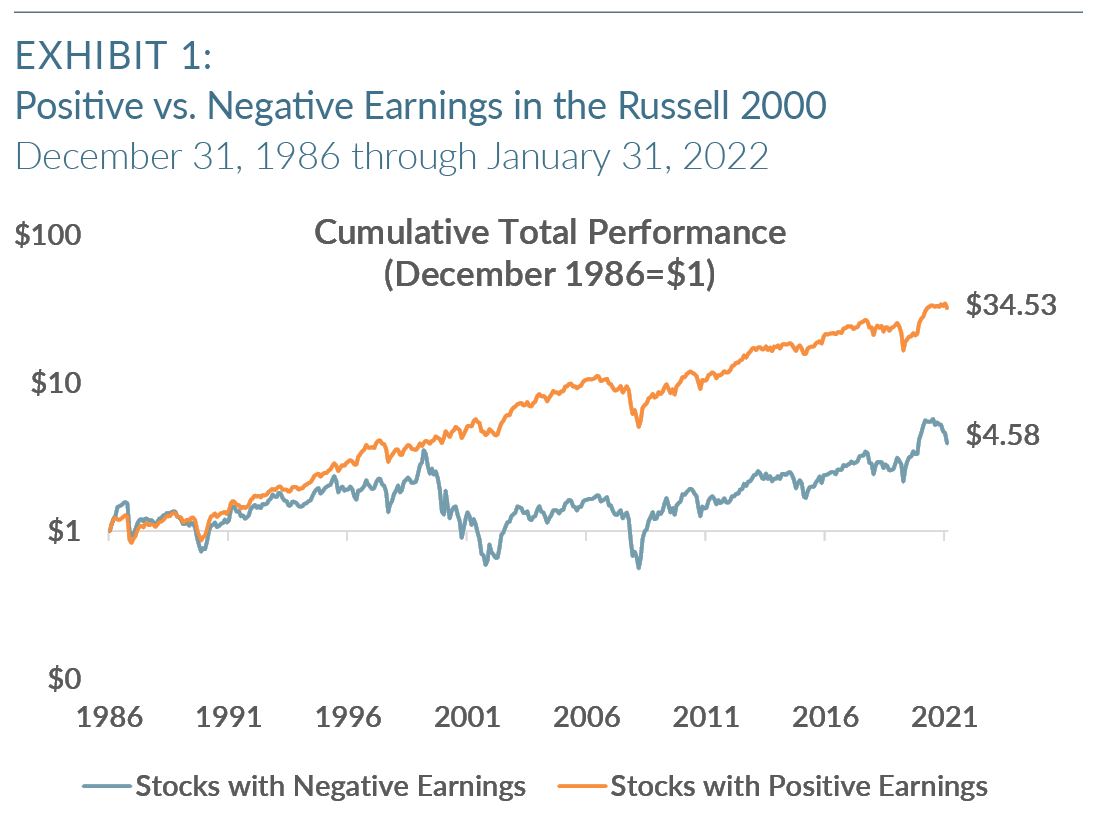
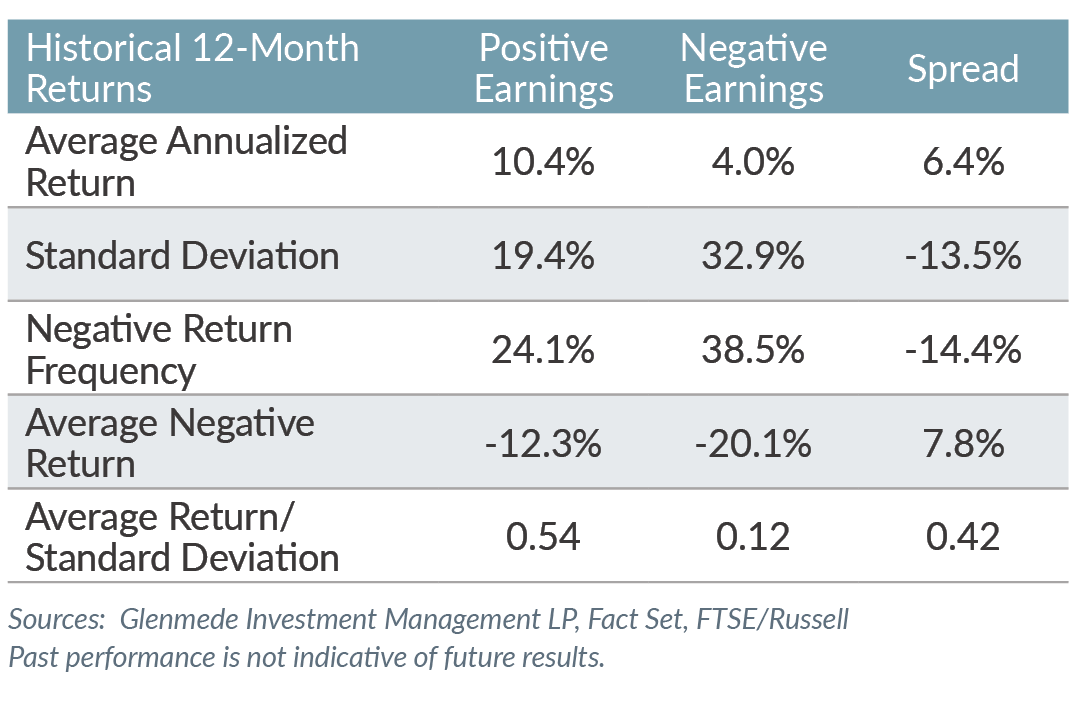
A significant portion of this outperformance was generated by avoiding the large drawdowns seen in the collapse of the internet bubble in the early 2000s and the global financial crisis in 2008. The internet bubble, in particular, saw negative earning stocks significantly outperform before a collapse. The financial crisis did not see such a dramatic period of outperformance prior to the collapse, but negative earners substantially underperformed during the crisis. A powerful rally in negative earning stocks ensued once the Federal Reserve initiated its quantitative easing protocols beginning in Q4 2008. These unconventional banking operations are only recently beginning to be wound down by the Fed.
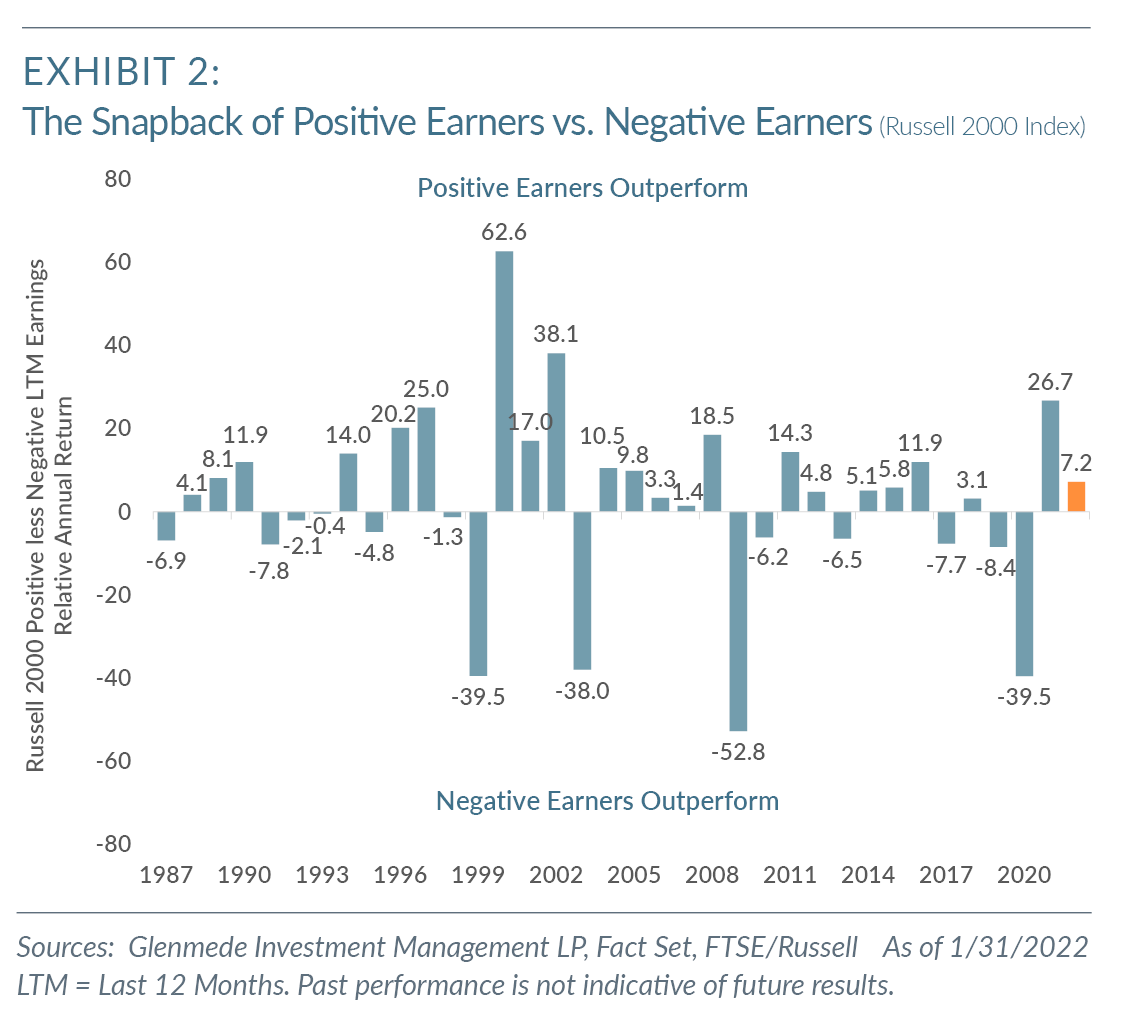
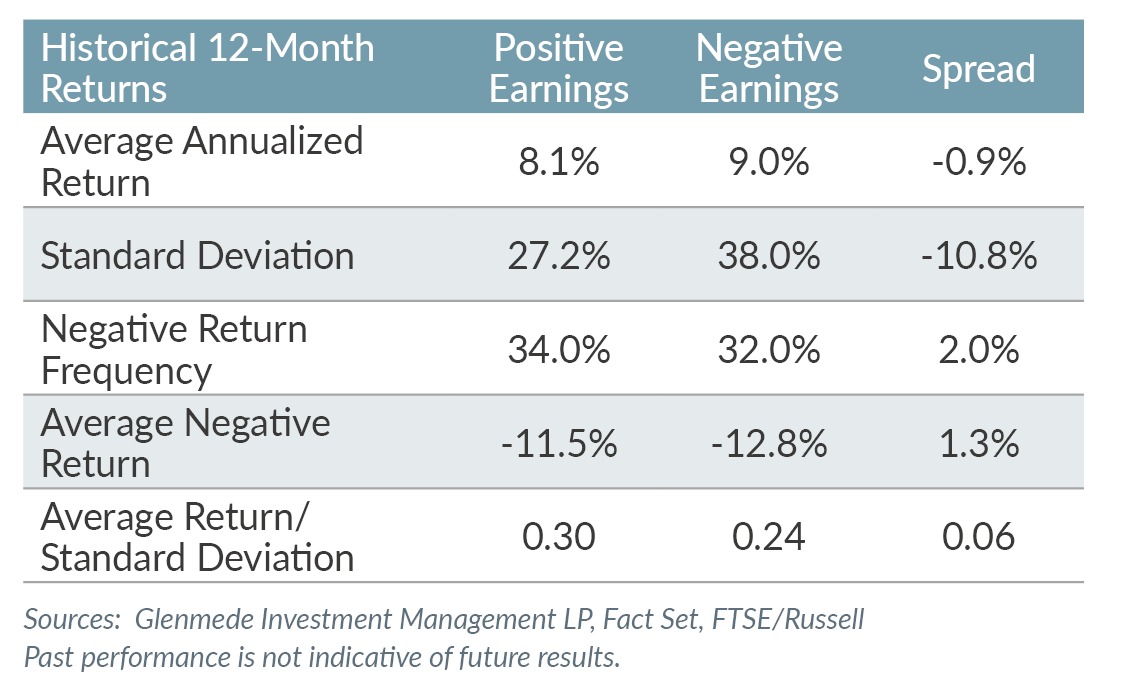
Exhibit 2 highlights the differences in annual performance of the two buckets (positive and negative earners) and shows that periods of negative earner outperformance tend to be cyclical but not persistent.
Cyclicality of negative earners
The cyclicality of negative earners’ outperformance is easily seen, as is its typically short duration. Recent evidence suggests that a period of negative earner underperformance may, in fact, be underway.
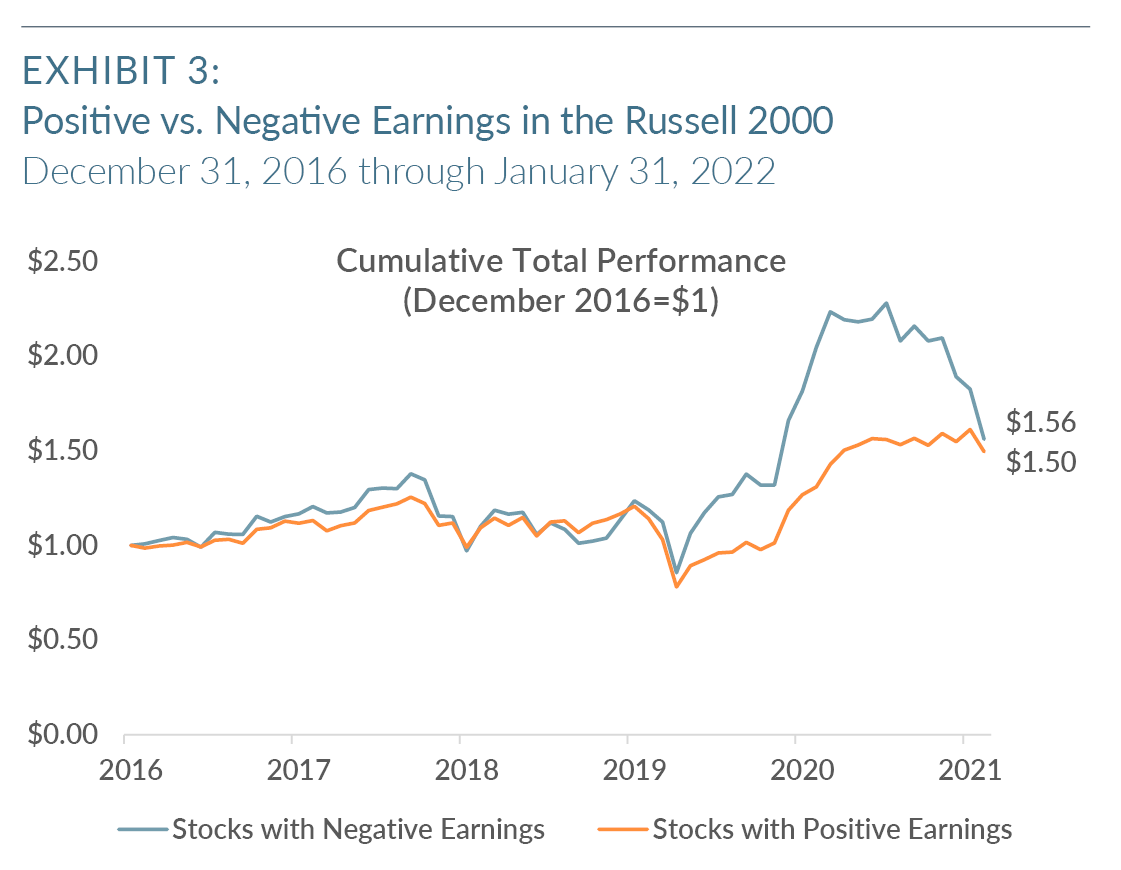
In Exhibit 3, we have recreated Exhibit 1 examining positive versus negative earning stocks, but with a starting point of December 31, 2016. That story is not so compelling in favor of positive earning companies due to the strength of negative earners through 2020. The chart in Exhibit 3 clearly shows the possible inflection point between the two groups that occurred in mid-2021. As the table in Exhibit 3 reveals, the risk characteristics have become more mixed during this five-year period, whereby the normally riskier negative earners appear to share similar risk profiles to the positive earners, an unusual phenomenon.
Given that small cap companies tend to be newer and less mature businesses, the Russell 2000 Index will always include a significant number of negative earners. Over time, these companies will typically become more established and begin to generate earnings, become acquisition candidates or will no longer remain going concerns. In Exhibit 4, we break out the percentage of negative earners in the Russell 2000 going back to 1993 on a rolling 12-month basis. As of Q4 2021, 34% of the Russell 2000 reported negative earnings on a trailing-12-month basis, a record high.
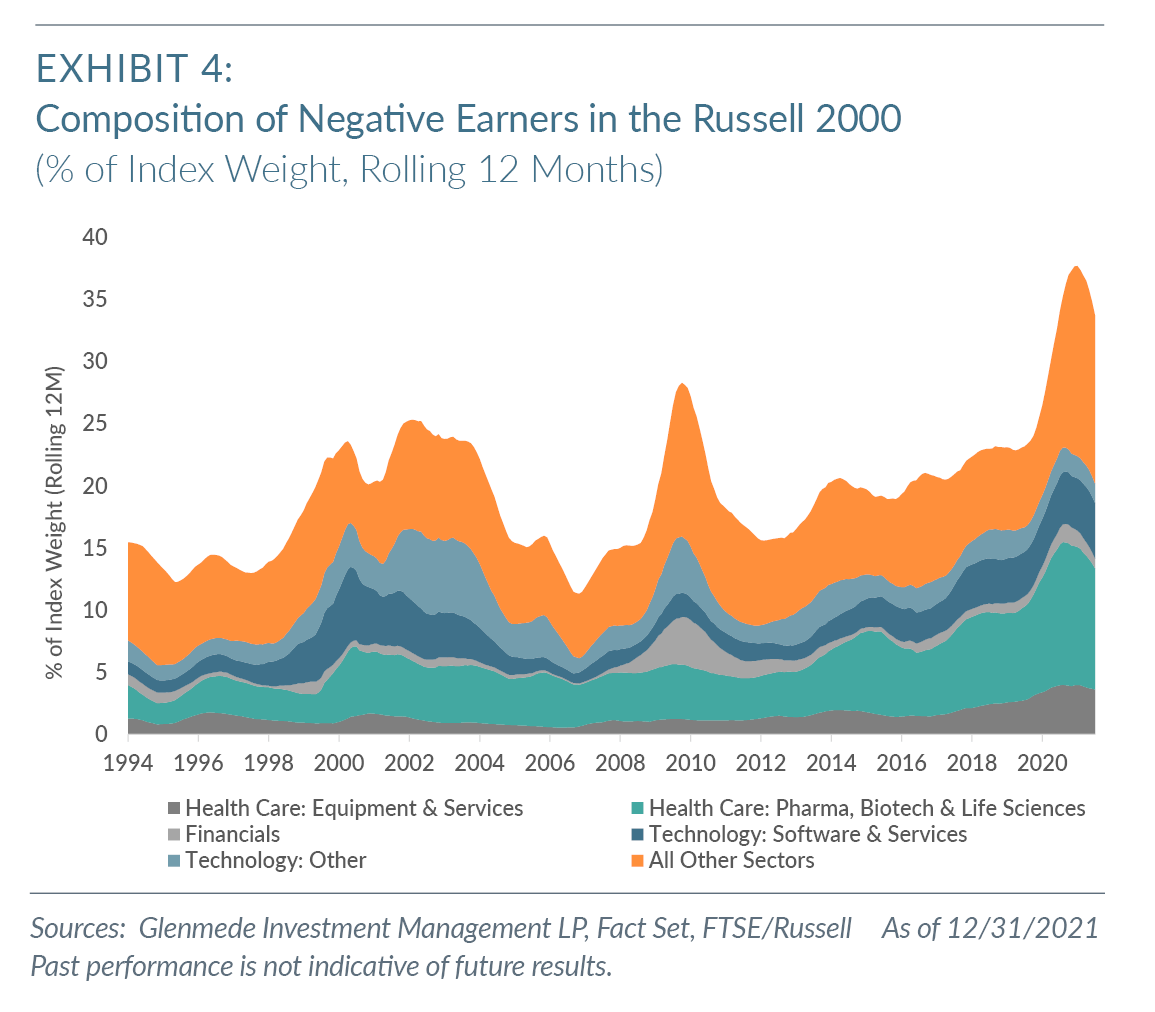
Composition of benchmark growth
For illustrative purposes, we highlight the industries that have accounted for the majority of the benchmark’s growth in negative earners over time. During the internet bubble in the late 1990s, it was the Information Technology-related industries that contributed most heavily to the benchmark’s growth in negative earners and their outperformance. It was the Financials sector that saw an uptick in the percentage of negative earners during the period following the financial crisis in which central bank policy kept impaired businesses afloat. These industries then mean reverted as the performance drawdowns impacted negative earners more significantly than the positive earners.
If past is prologue, it is worth taking a deeper look at the negative earning industries most heavily represented in the benchmark as of this writing. The current period has been driven by Technology (Software & Services) and Health Care (Pharma, Biotech & Life Sciences). Negative earning stocks in the Health Care sector have contributed most heavily to the increased weight of negative earners in the benchmark and, therefore, are worth a deeper look.
Exhibit 5 shows the significant outperformance of companies with negative earnings through mid-2021 within the Pharma & Biotech industry group and the recent dramatic sell-off.
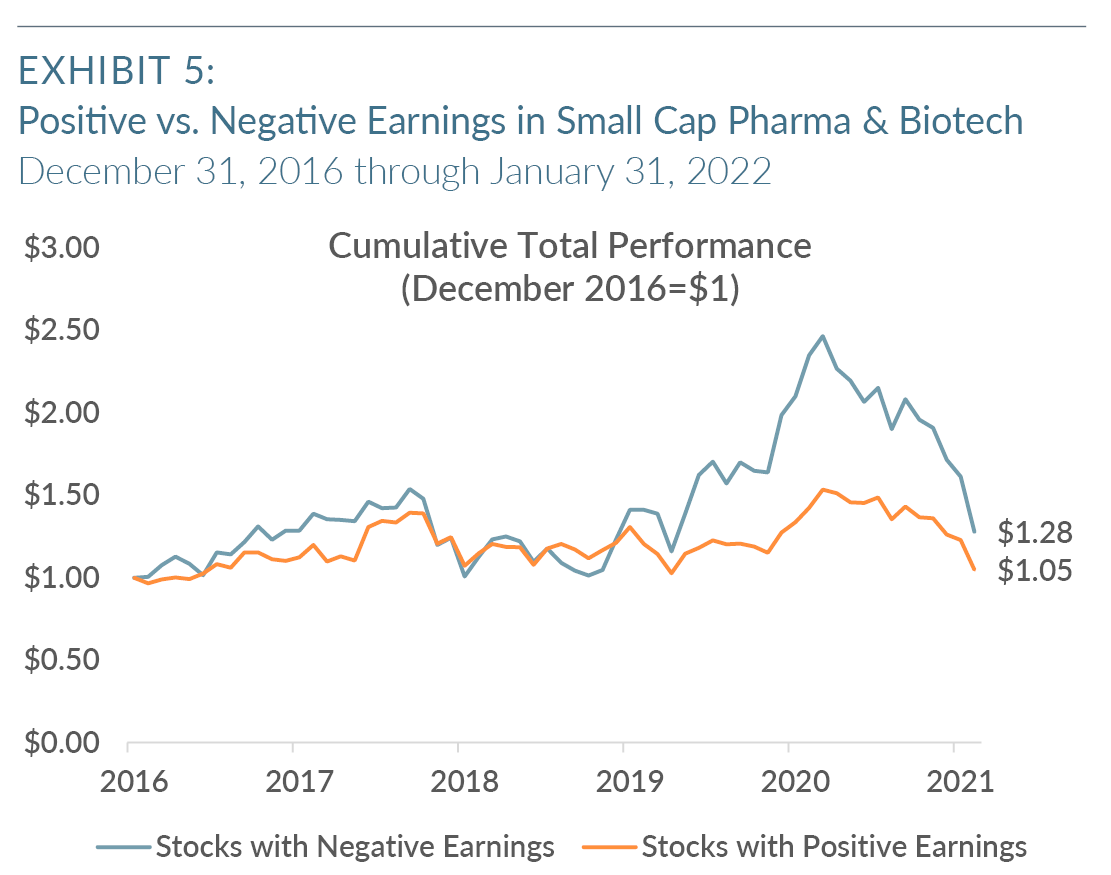
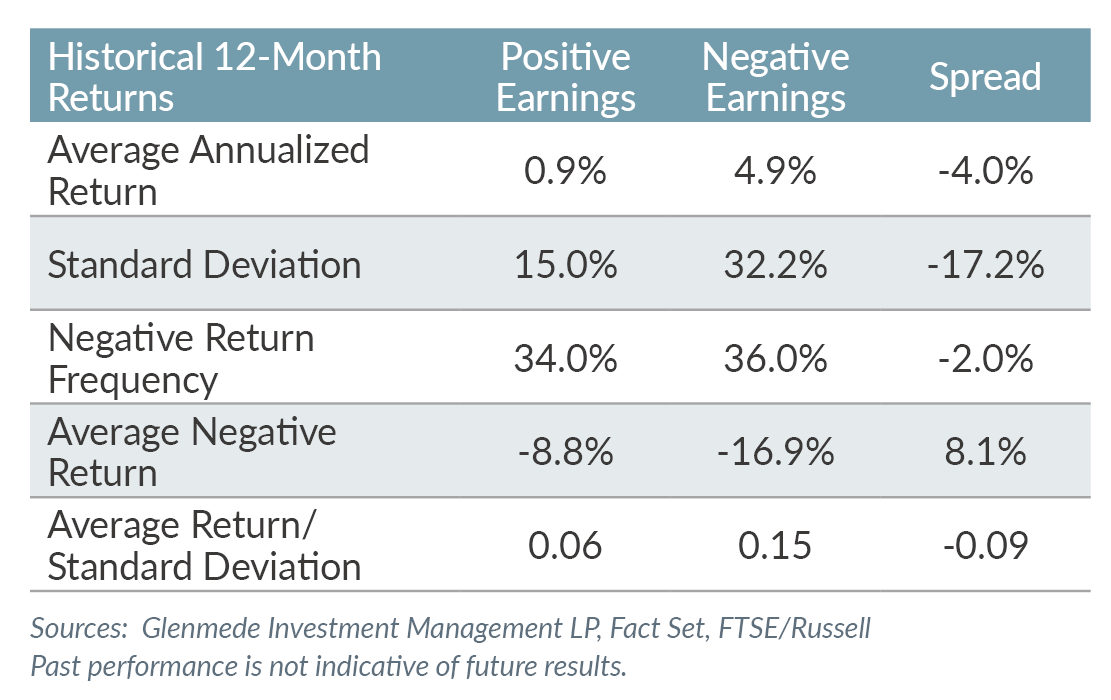
The table in Exhibit 5 illustrates that the negative earners in this group have shown more downside risk than the positive earners. As the chart shows, there has been significantly more upside return from the companies with negative earnings as well, although this gap is rapidly closing as investors appear to be more discriminating.
Periods in which negative earners enjoy a significant level of outperformance seem to coincide with unusual circumstances driving investor perception. The persistence of low interest rates over the past decade has allowed the creation of investment narratives that justify certain asset classes and their valuations. A common narrative was the co-opting of a fixed income concept called duration and the application of this concept to growth-oriented companies that were expected to generate significant cash flows in future years. A low discount rate due to the Fed’s zero bound rate policy meant (in theory) that these companies could be afforded a higher multiple. This theory is what led to the dominance of large capitalization growth companies over the past decade. It seems, however, that the same argument began to be applied to the faster growing but profitless companies in the Russell 2000, which fed their outperformance. The recent underperformance of these companies would suggest that there has been a significant shift in investor sentiment.
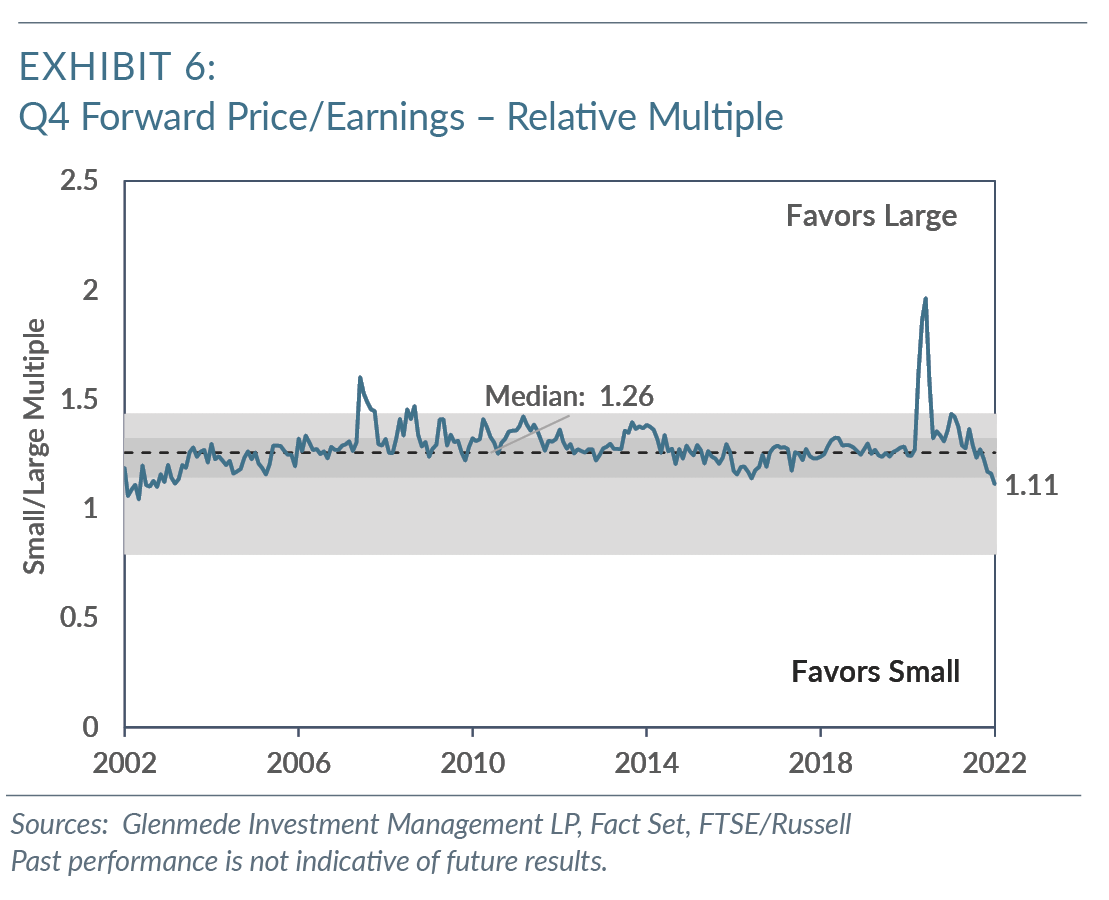
Exhibit 6 is illustrative of how quickly investor sentiment has been changing. At the end of January, the Russell 2000 was trading at a forward price/earnings ratio that was cheaper than where it stood pre-COVID-19. Additionally, it is now cheaper relative to the Russell 1000 large cap benchmark any time since the early 2000s. An earnings multiple can often be used as a surrogate for investor perceptions and sentiment toward a stock or index. In this case, it is obvious that investors have gravitated back to the winning trade of the past decade (large caps) and are wary of opportunities in small caps. We would argue that markets are in the midst of an investment regime change as monetary policy is shifting away from extreme accommodation to a more neutral stance. Investors are often slow to recognize when these shifts have occurred, particularly if they have had success in the prior regime. Behavioral biases then begin to impact markets far more than fundamentals, creating opportunity as the investing crowd blunders. It is possible that the broad avoidance of small caps is one of these blunders.
Conclusion
Periods of outperformance by negative earning stocks is not a new phenomenon. This outperformance has tended to be cyclical, not persistent, and concentrated around speculative environments. Over the past five years, negative earning stocks concentrated in the Pharma & Biotech industry group have held a clear performance edge over their positive earning peers. It is our view that while the current period has proven to be of a longer duration than is typical, it will end up proving to be cyclical as well and that the downside resolution of this condition has already begun. As a result, we expect to see mean reversion in which stocks with positive earnings retake their leadership position relative to stocks with negative earnings as the latter group experiences share price erosion.
1 We define a negative earner as any company without earnings over the trailing 12 months.
2 This start date was chosen due to availability of industry data.
All data is as of 12/31/2021 unless otherwise noted. Opinions represent those of Glenmede Investment Management LP (GIM) as of the date of this report and are for general informational purposes only. This document is intended for sophisticated, institutional investors only and is not intended to predict or guarantee the future performance of any individual security, market sector or the markets generally. GIM’s opinions may change at any time without notice to you.
Any opinions, expectations or projections expressed herein are based on information available at the time of publication and may change thereafter, and actual future developments or outcomes (including performance) may differ materially from any opinions, expectations or projections expressed herein due to various risks and uncertainties. Information obtained from third parties, including any source identified herein, is assumed to be reliable, but accuracy cannot be assured. This paper represents the view of its authors as of the date it was produced and may change without notice. There can be no assurance that the same factors would result in the same decisions being made in the future. In addition, the views are not intended as a recommendation of any security, sector or product. Returns reported represent past performance and are not indicative of future results. Actual performance may be lower or higher than the performance set forth above. For institutional adviser use only, not intended to be shared with retail clients.
The Russell 2000 Index is an unmanaged, market value weighted index, which measures performance of the 2,000 companies that are between the 1,000th and 3,000th largest in the market. One cannot invest directly in an index.