Market Snapshot: Broadening Participation of S&P 500 Constituents to Start the Year
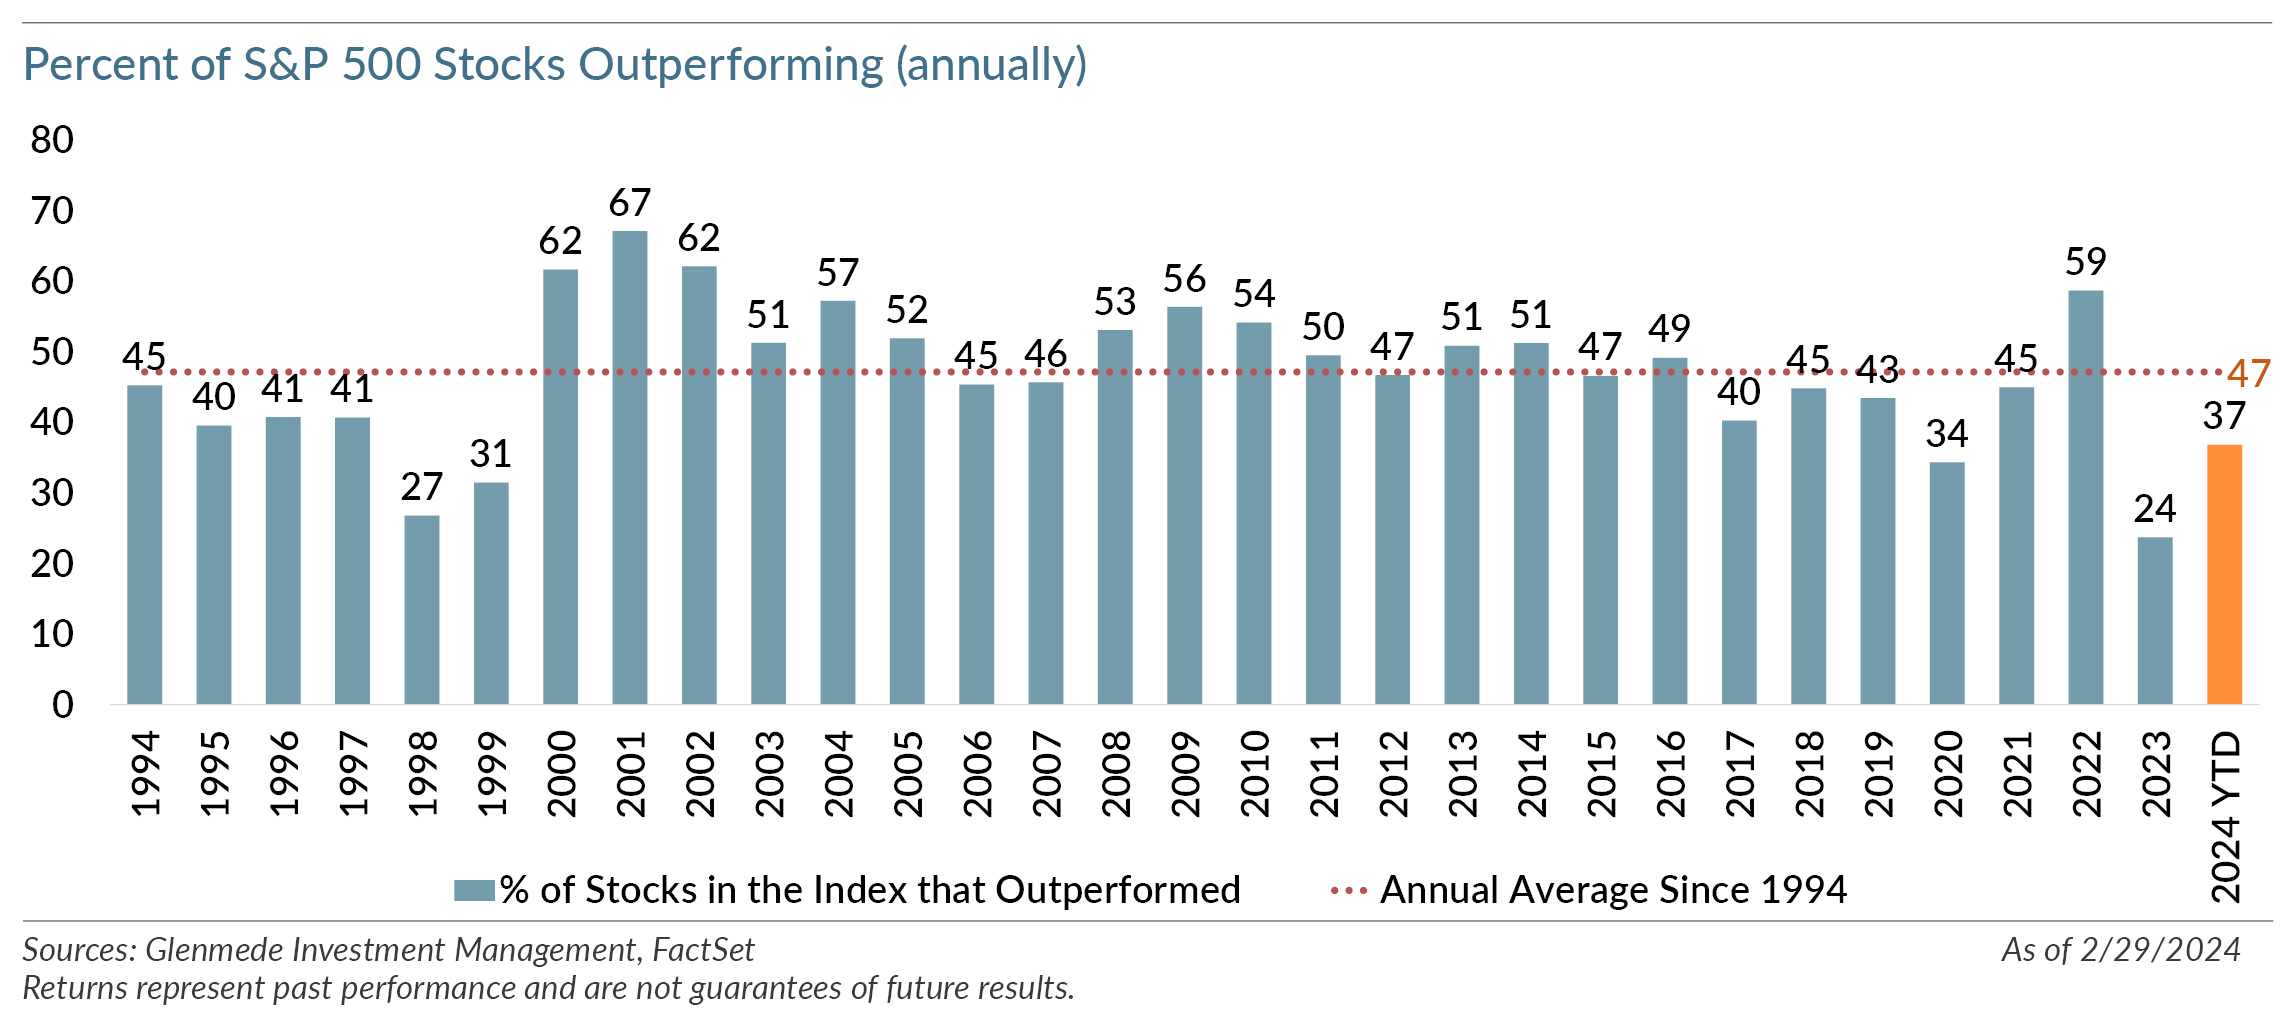
As of the first two months of 2024, market participation of the S&P 500 constituents has increased from last year’s 30-year lows. As shown in the chart, last year saw 24% of S&P 500 companies outperform the index, the lowest in a 30-year period which included the dot-com era. As of February month-end, almost 37% of the index constituents have outperformed the S&P 500. While this value is still lower than the 30-year average of 47%, it is off the lows hit last year.
Market concentration of the S&P 500 with the “Magnificent Seven” (Apple Inc., Microsoft Corporation, Alphabet Inc., Amazon.com, Inc., NVIDIA Corporation, Tesla, Inc. and Meta Platforms, Inc.) was the dominant story last year. These seven stocks accounted for 62% of the S&P 500 return in 2023. As of month-end, these seven stocks accounted for approximately 44% of the S&P 500 return, with three of the seven companies seeing negative returns year-to-date.
We continue to believe there are attractive opportunities within large cap stocks, although we acknowledge the S&P 500 has areas that are expensive on a historical basis. If we exclude the 100 most expensive names in the S&P 500, the remaining 400 stocks trade at a forward price/earnings (P/E) multiple of 14.5x, which is in the 68th percentile of monthly observations since 1993. The most expensive 100 constituents in the S&P 500 based on a forward P/E trade at 37.6x and are in the 85th percentile of observations since 1993. As a complement to a large cap passive allocation with concentration risk and exposure to some of the more expensive stocks, we continue to favor active large cap strategies with overweight positions to attractively valued companies and underweights to the more expensive companies.
Views expressed include opinions of the portfolio managers as of February 29, 2024 based on the facts then available to them. All facts are gathered in good faith from public sources, but accuracy is not guaranteed. Nothing herein is intended as a recommendation of any security, sector or product. Returns represent past performance and are not guarantees of future results. Actual performance in a given account may be lower or higher than what is set forth above. All investment has risk, including risk of loss. Designed for professional and adviser use.