Market Updates
September 28, 2023
Market Snapshot: When Forecasting Interest Rates Gets Cloudy
What’s Wrong With This Picture?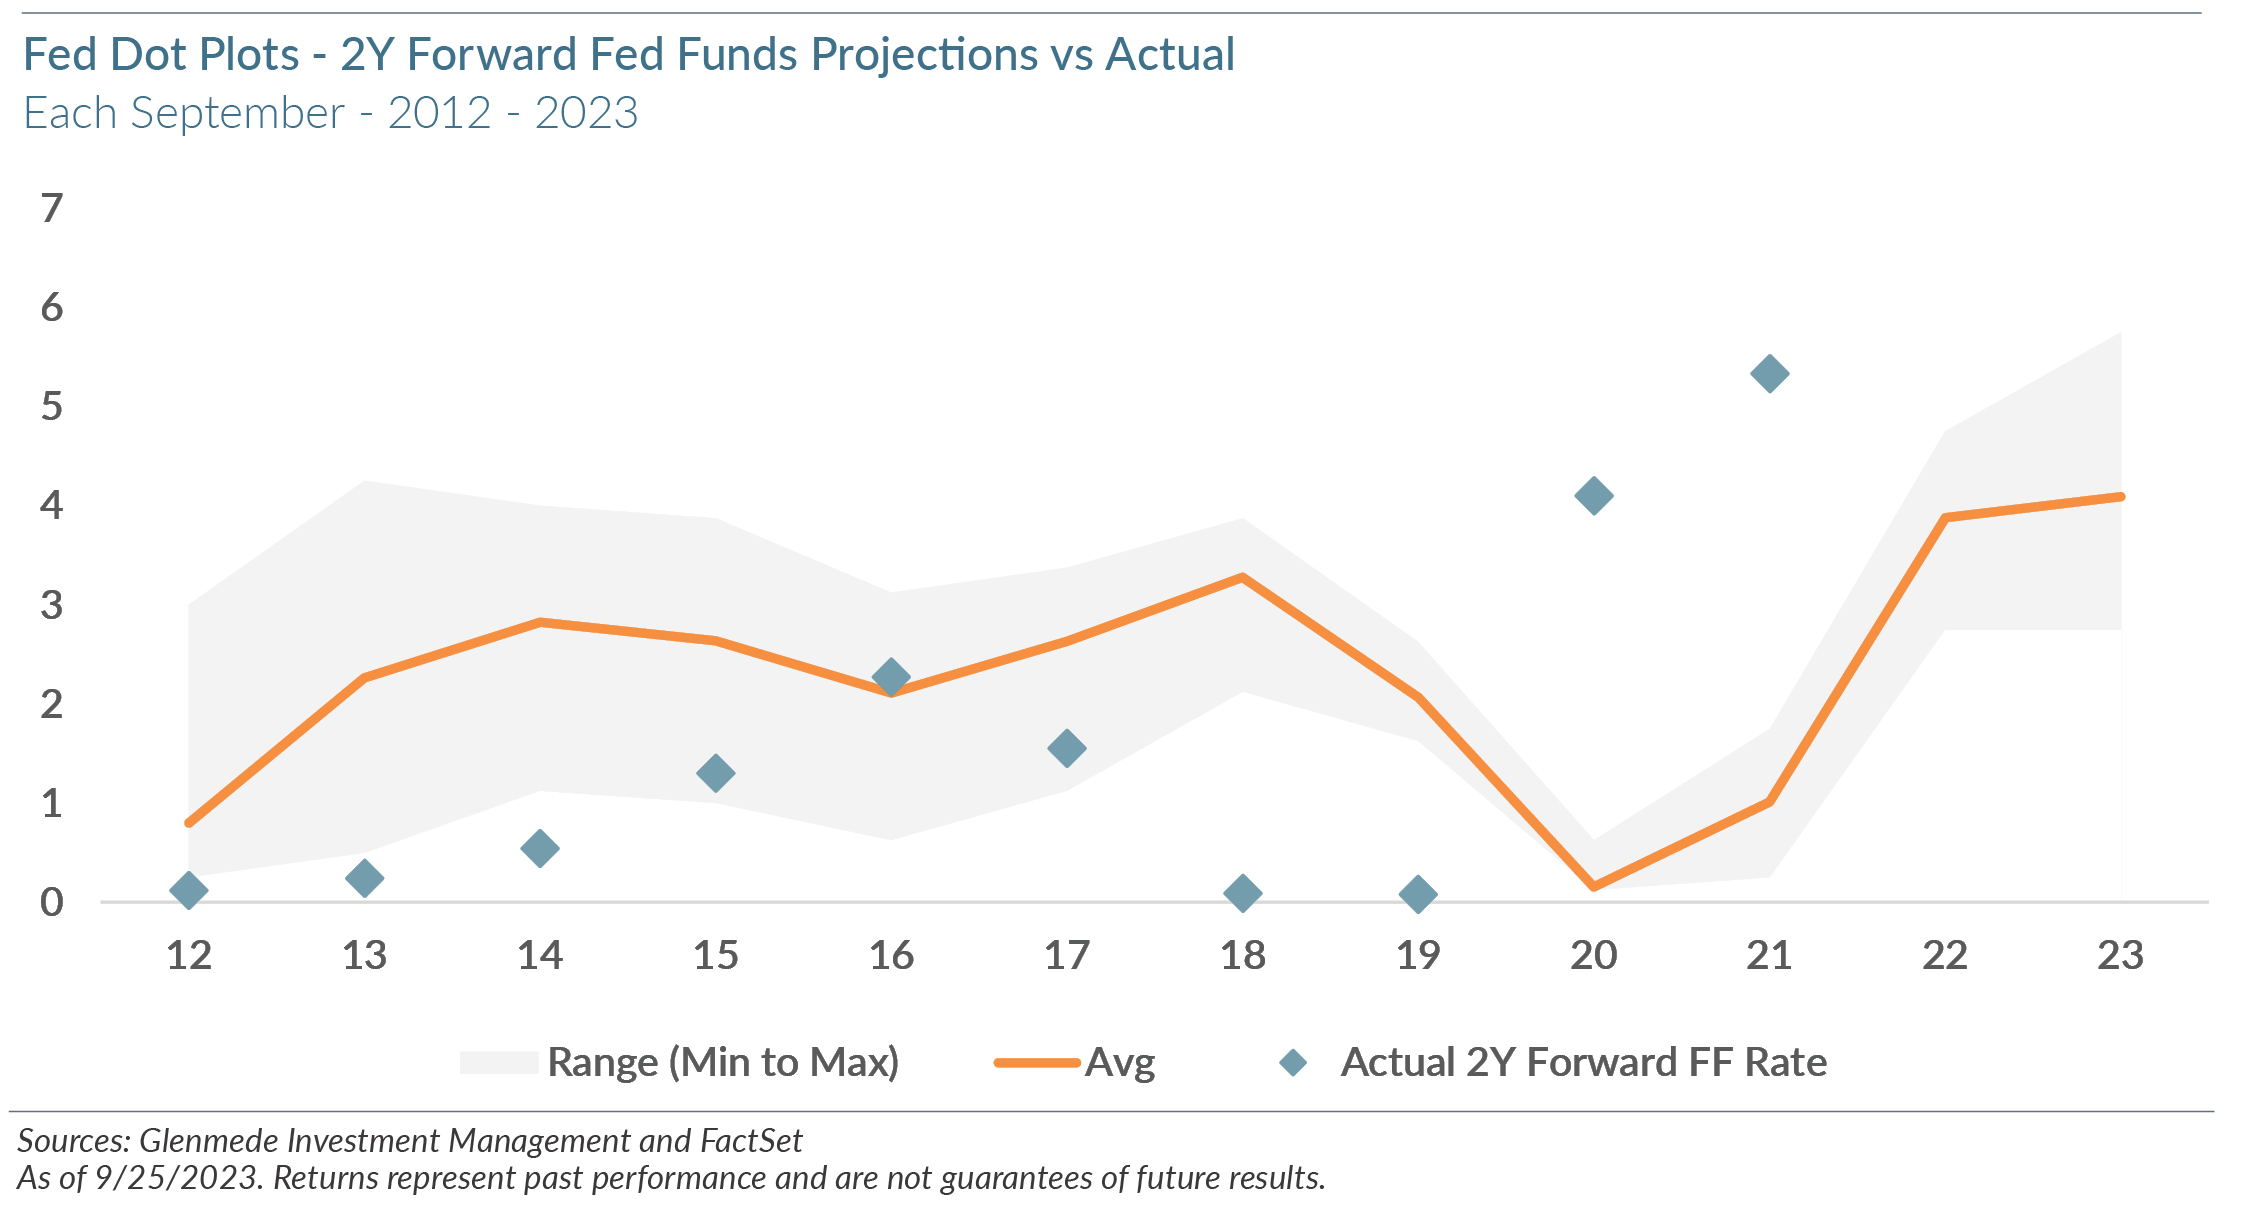
- The Fed’s dot plot is again causing a stir as investors try to glean wisdom about the long-term trajectory of interest rates. Some prominent publications are even suggesting that the change in the longer-term rate forecasts indicates a “higher forever” regime. But before we opine on the potential ramifications, it would be prudent to ask whether the Fed’s projections are historically predictive. Based on September reports of the dot plots since 2012, the Fed’s short-term projections through year-ends (roughly three-and-a-half-month windows) were spot on with a correlation of 0.996 to the year-end fed funds rate. This should surprise no one. By September the Fed has likely discussed policy through year end and is unlikely to change course in a major way.
- The picture changes drastically, however, when one looks beyond the window. Projections for the following year (roughly 15 ½ months out) have had a much lower correlation of 0.61. While this is better than using the current fed funds rate level at the time of prediction (0.42 correlation), it was worse than using the Fed’s prediction for the current year (0.62 correlation). In other words, history suggests one would arguably have been better off using 2023’s rate projections and throwing out any information for 2024. Furthermore, the Fed projections for two years out reflect whipsaws: an astoundingly negative correlation of -0.82 versus actual fed funds rates with an average error of more than 2%!
- So, what is going on below the surface? The latest longer-term dot plot forecasts suggest that the fed funds rate will gradually revert over several years to the Fed’s long-term estimate of its neutral rate (about 2.5%). While this might work in a “normal” environment cooked up in an academic setting, we have not seen this “normal” reversion empirically. Instead, we have found better efficacy in using the slope of the yield curve (e.g., the 1 year rate minus the fed funds rate) to forecast the intermediate term trajectory of interest rates with the Fed’s year-end estimate as the initial starting point. While the Fed’s short-term rate forecasts have been accurate, using market data can noticeably improve forecasts of longer-term interest rate movements over using the dot plots alone (correlations of 0.66 vs 0.62 for the 1 year forecast, and -0.51 vs -0.82 for the 2 year forecast). The moral here is that we should take cues from the markets, where capital is at risk, rather than only focusing on how the Fed would “like” or “expect” interest rates to behave over the longer term.
Views expressed include opinions of the portfolio managers as of September 28, 2023, based on the facts then available to them. All facts are gathered in good faith from public sources, but accuracy is not guaranteed. Nothing herein is intended as a recommendation of any security, sector or product. Returns represent past performance and are not guarantees of future results. Actual performance in a given account may be lower or higher than what is set forth above. All investment has risk, including risk of loss. Designed for professional and adviser use.