Negative Earners in Small Caps: The Saga Continues
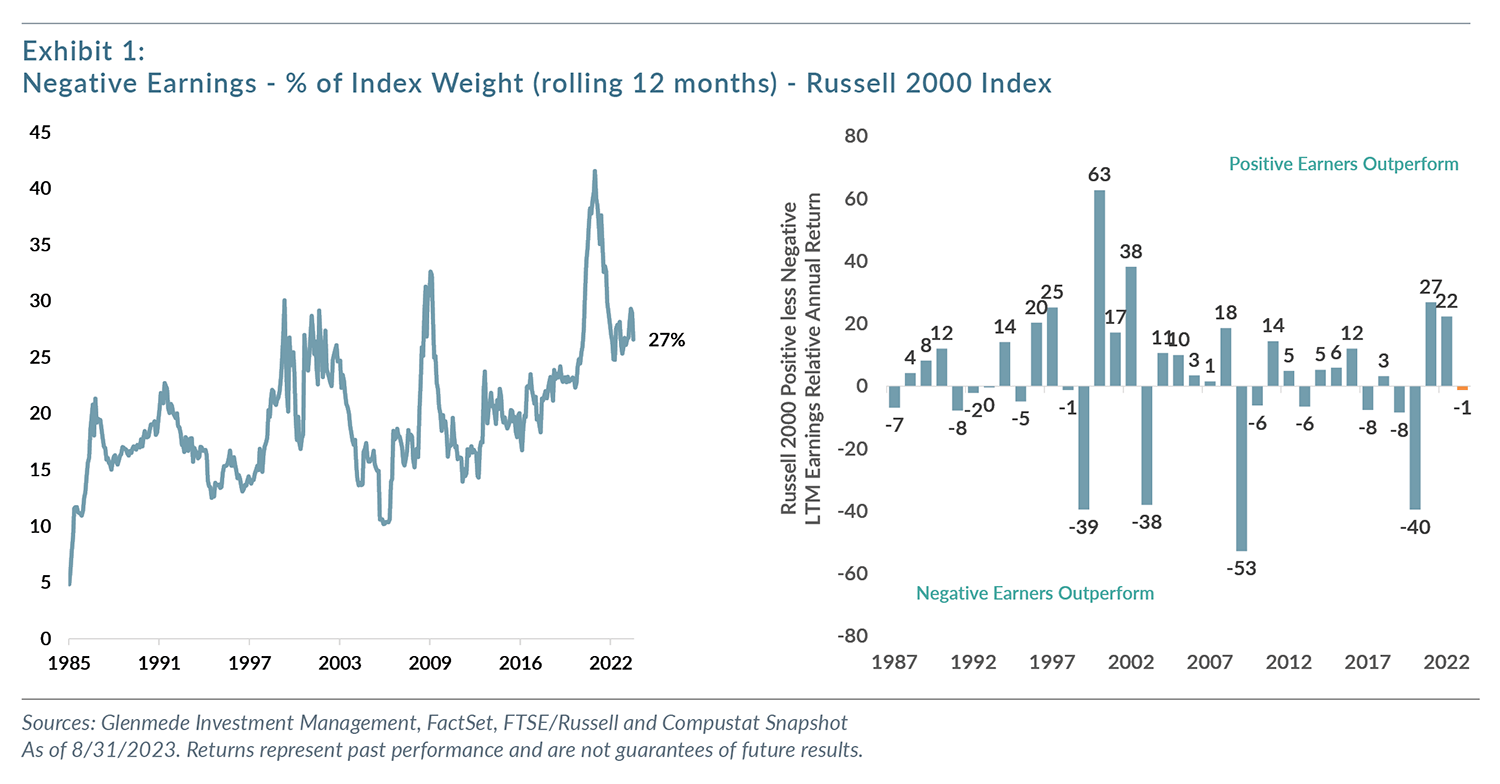
In our Fall 2020 paper, “Why Profitability Matters: Positive Versus Negative Earners”, we examined the composition of the Russell 2000 Index and noted the extended percentage of negative earners in the benchmark and outsized returns the cohort had exerted. Our analysis suggested that periods of negative earner outperformance tended to be episodic in nature rather than persistent. We suggested that periods in which negative earners saw significant share price appreciation typically were resolved through share price deterioration as one typically observes when an investment bubble bursts.
In this article, we re-examine the evidence to see if our thesis proved correct over the ensuing 36 months and note a few items that have evolved in a different way than expected. The two charts in Exhibit 1 clearly show that our thesis was correct in identifying the bubble and its collapse. But we were incorrect in our expectation that the percentage of negative earners in the benchmark would revert back to its long term mean of ~20% of the index. Additionally, we have been surprised by the resurgent performance advantage of negative earners over positive earners thus far in 2023 as investors are typically loathe to invest in speculative issues so soon after a bubble has burst.
Low Quality IPOs
A possible explanation for the persistently high percentage of negative earners in the Russell 2000 Index lies in the nature of the recent market for Initial Public Offerings (IPOs). Exhibit 2 shows the percentage of companies that have entered the Russell 2000 index that are considered to be negative earners going back to 1985. For this exercise, we consider new entrants to be companies without trading records or index weight 3 years prior to measurement. One can assume that these issues are spin offs or IPOs. For this chart, Established firms are companies with at least 36 months in the Russell 2000 Index at the time of measurement.
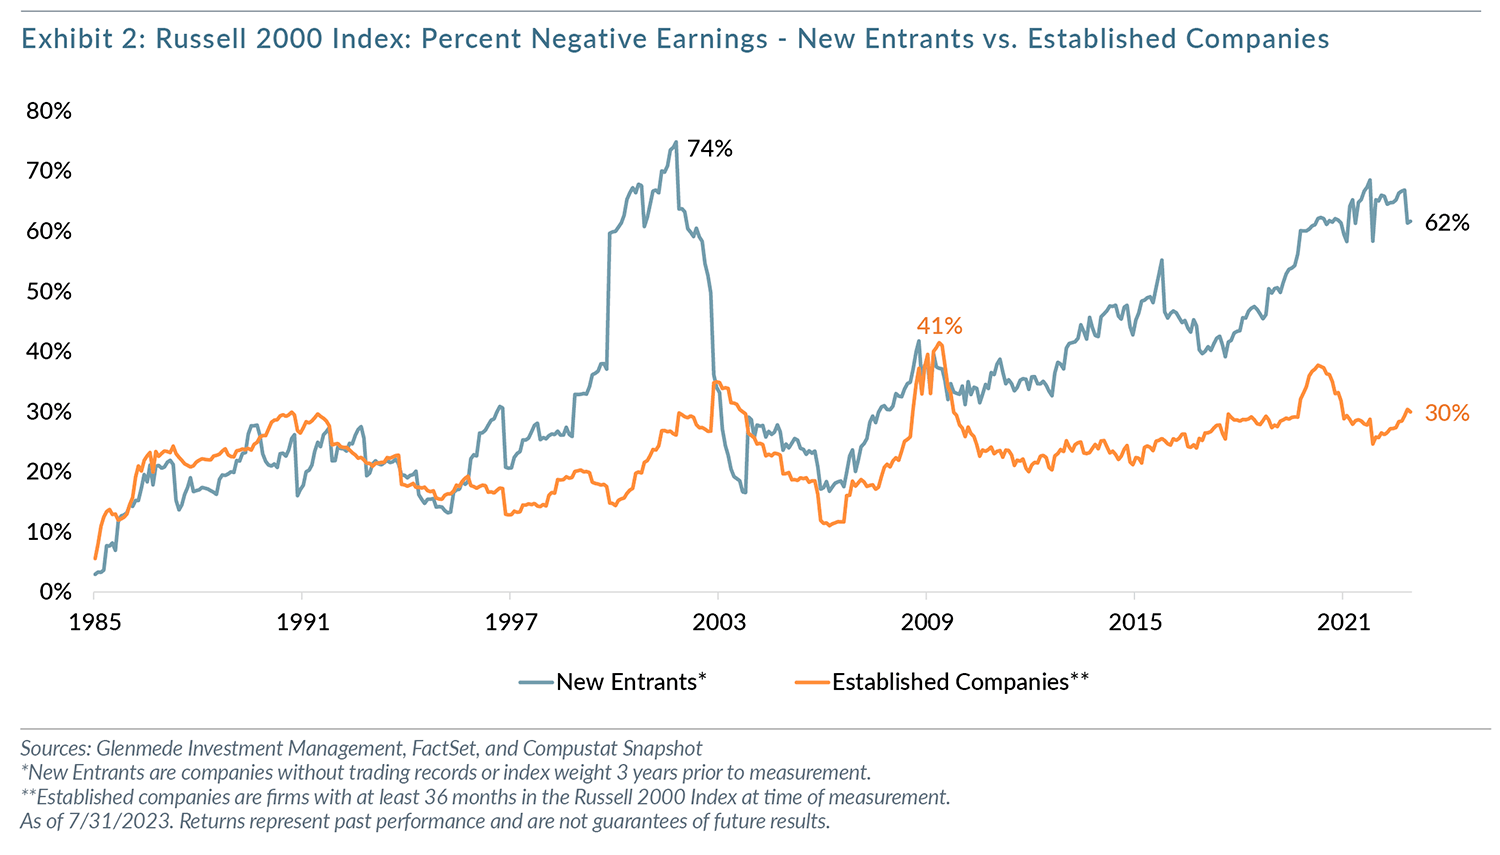
One can clearly see that the current percentage of negative earning new entrants is at an historic high of 62%, a level only surpassed during the Dot.Com bubble of 2001. At the same time, the percentage of established companies that are negative earners has remained relatively static over this time period.
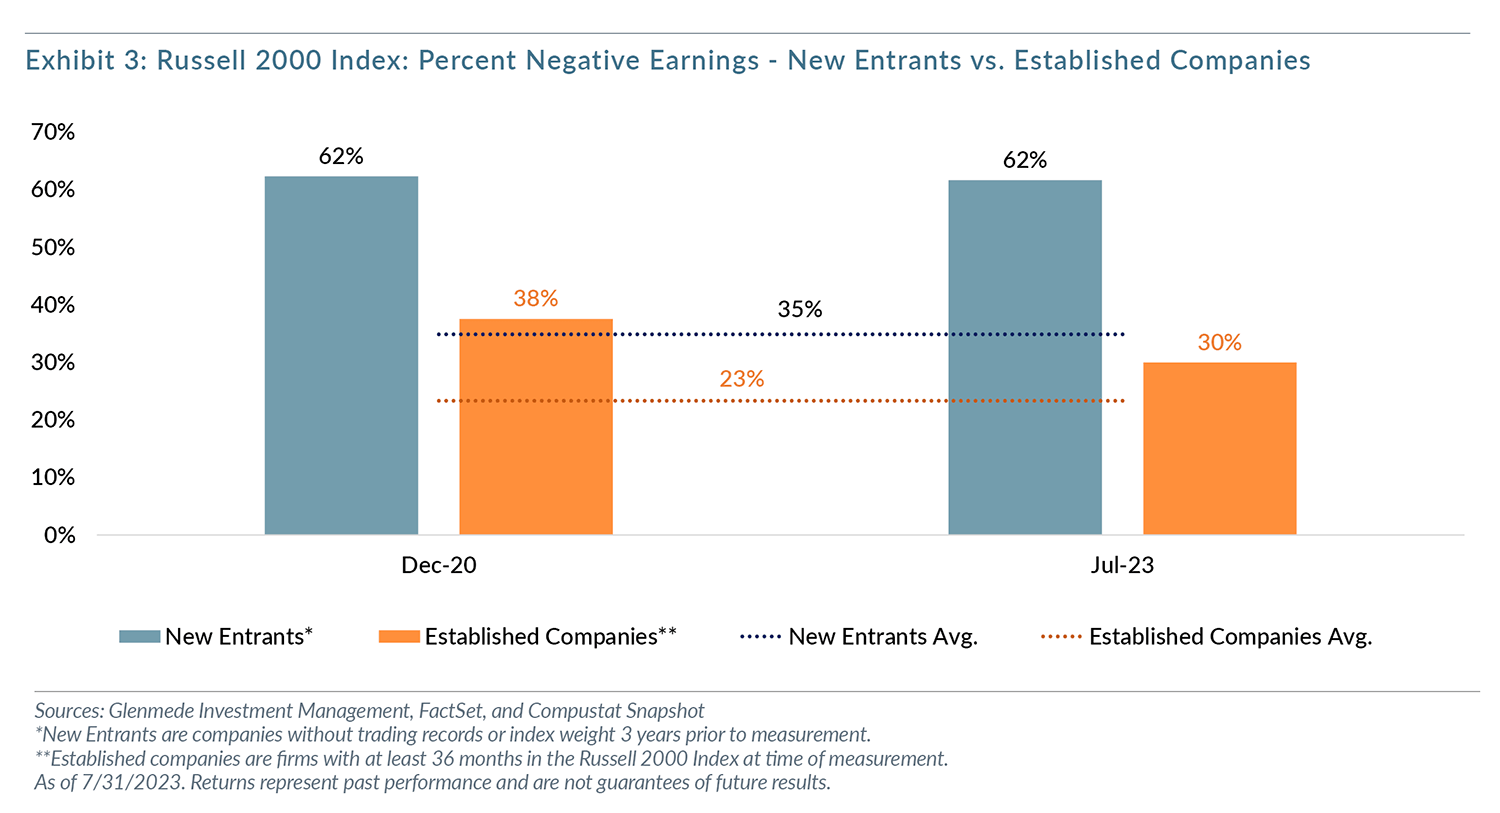
Another way to analyze this data set is in Exhibit 3 which examines two specific points in time. We would consider December 2020 to be the peak of negative earner influence on the benchmark and one can see that both the new entrant and established company cohorts that were negative earners is elevated relative their historic average. Moving forward to July 2023, it is striking to see the sharp decline in the percentage of negative earners in the established company group while the new entrant percentage has remained the same. This data indicates that newly public companies are twice as likely to have negative earnings today, which is historically anomalous.
Zero Interest Rate Policies to Blame?
While it is impossible to assign a single source of causation for this phenomenon, it is our contention that the decade of low interest rates has certainly played a part. Low rates allow companies without earnings to remain viable as there is a low bar to remain solvent. Excess liquidity found its way to these speculative companies as they were considered to be longer duration in nature due to the nature of their businesses and risk embracing private market investors continued to provide capital in the hopes of an outsized future return. The simple chart in Exhibit 4 of the yield on the 10-year Treasury below does appear to have a correlation with the increased percentage of negative earning new entrants we presented in Exhibit 3.
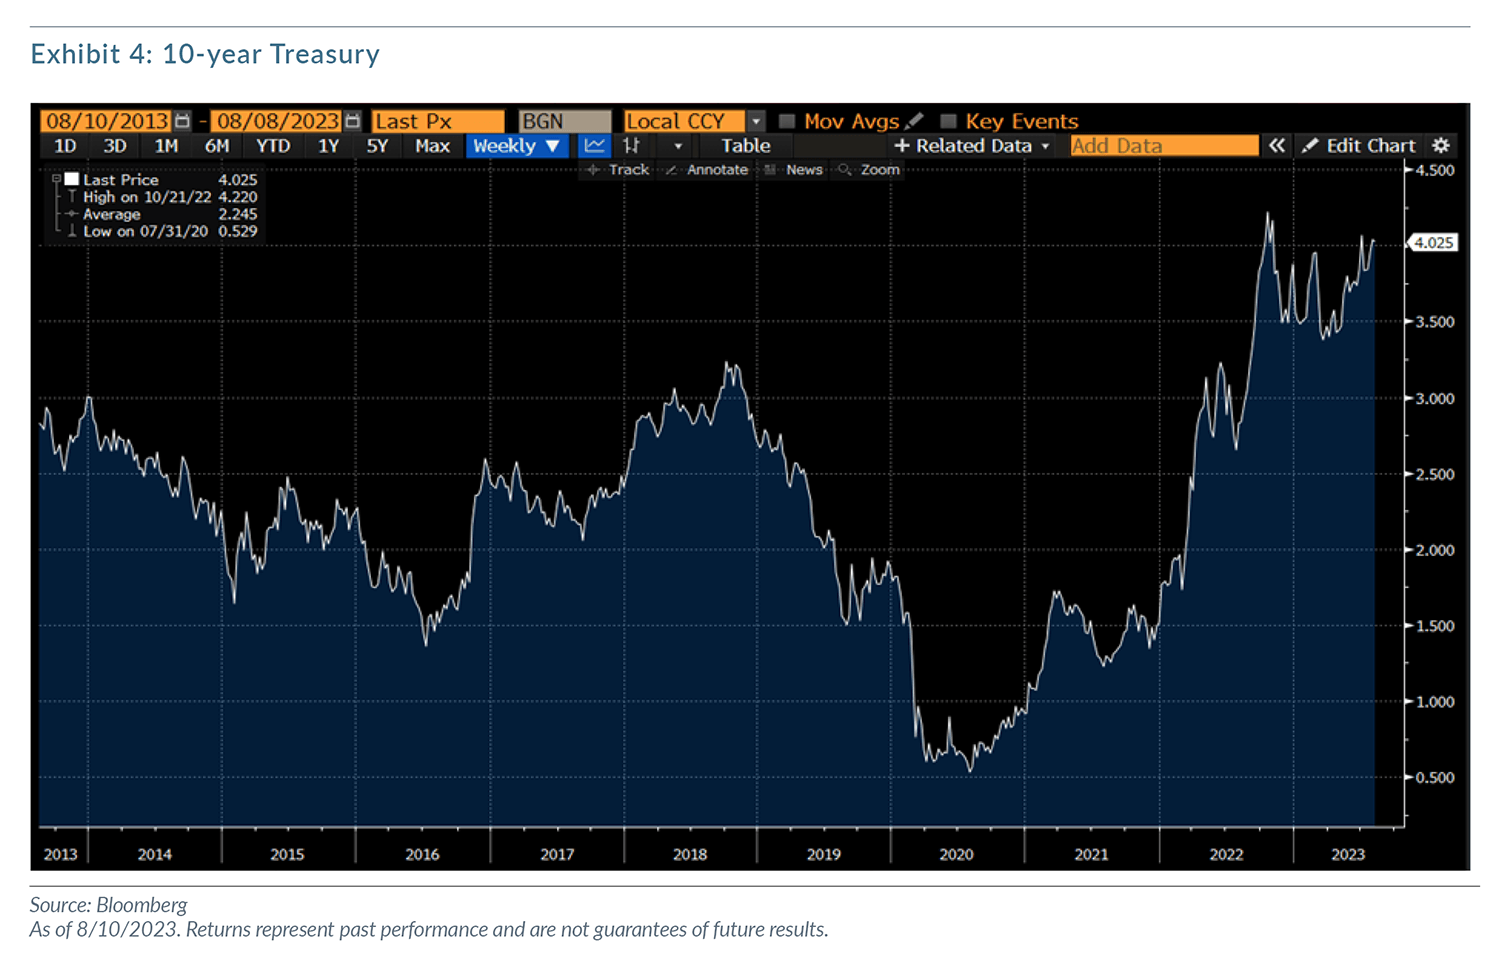
If there is indeed a linkage between the two, it would follow that the rapid increase in interest rates recently should greatly curtail the number of negative earning companies that IPO as they simply will not remain viable businesses and private market investors insist on a path to profitability as opposed to revenue growth. If this contention is correct, the overall percentage of negative earners in the Russell 2000 Index should continue to mean revert and the performance differential between negative and positive earners should once again tilt in the direction of positive earners.
All data is as of August 31, 2023 unless otherwise noted. Opinions represent those of Glenmede Investment Management LP (GIM) as of the date of this report and are for general informational purposes only. This document is intended for sophisticated, institutional investors only and is not intended to predict or guarantee the future performance of any individual security, market sector or the markets generally. GIM’s opinions may change at any time without notice to you.
Any opinions, expectations or projections expressed herein are based on information available at the time of publication and may change thereafter, and actual future developments or outcomes (including performance) may differ materially from any opinions, expectations or projections expressed herein due to various risks and uncertainties. Information obtained from third parties, including any source identified herein, is assumed to be reliable, but accuracy cannot be assured. This paper represents the view of its authors as of the date it was produced and may change without notice. There can be no assurance that the same factors would result in the same decisions being made in the future. In addition, the views are not intended as a recommendation of any security, sector or product. Returns reported represent past performance and are not indicative of future results. Actual performance may be lower or higher than the performance set forth above. For institutional adviser use only, not intended to be shared with retail clients.
The Russell 2000 Index is an unmanaged, market value weighted index, which measures performance of the 2,000 companies that are between the 1,000th and 3,000th largest in the market. One cannot invest directly in an index.