Market Snapshot: Narrow Leadership’s Last Stand?
For much of the past decade, U.S. equity market returns have been driven by a narrow group of the largest companies. Capitalization-weighted indices have rewarded size, as performance became increasingly dependent on a handful of mega cap stocks. That dynamic may be in the early stages of shifting.
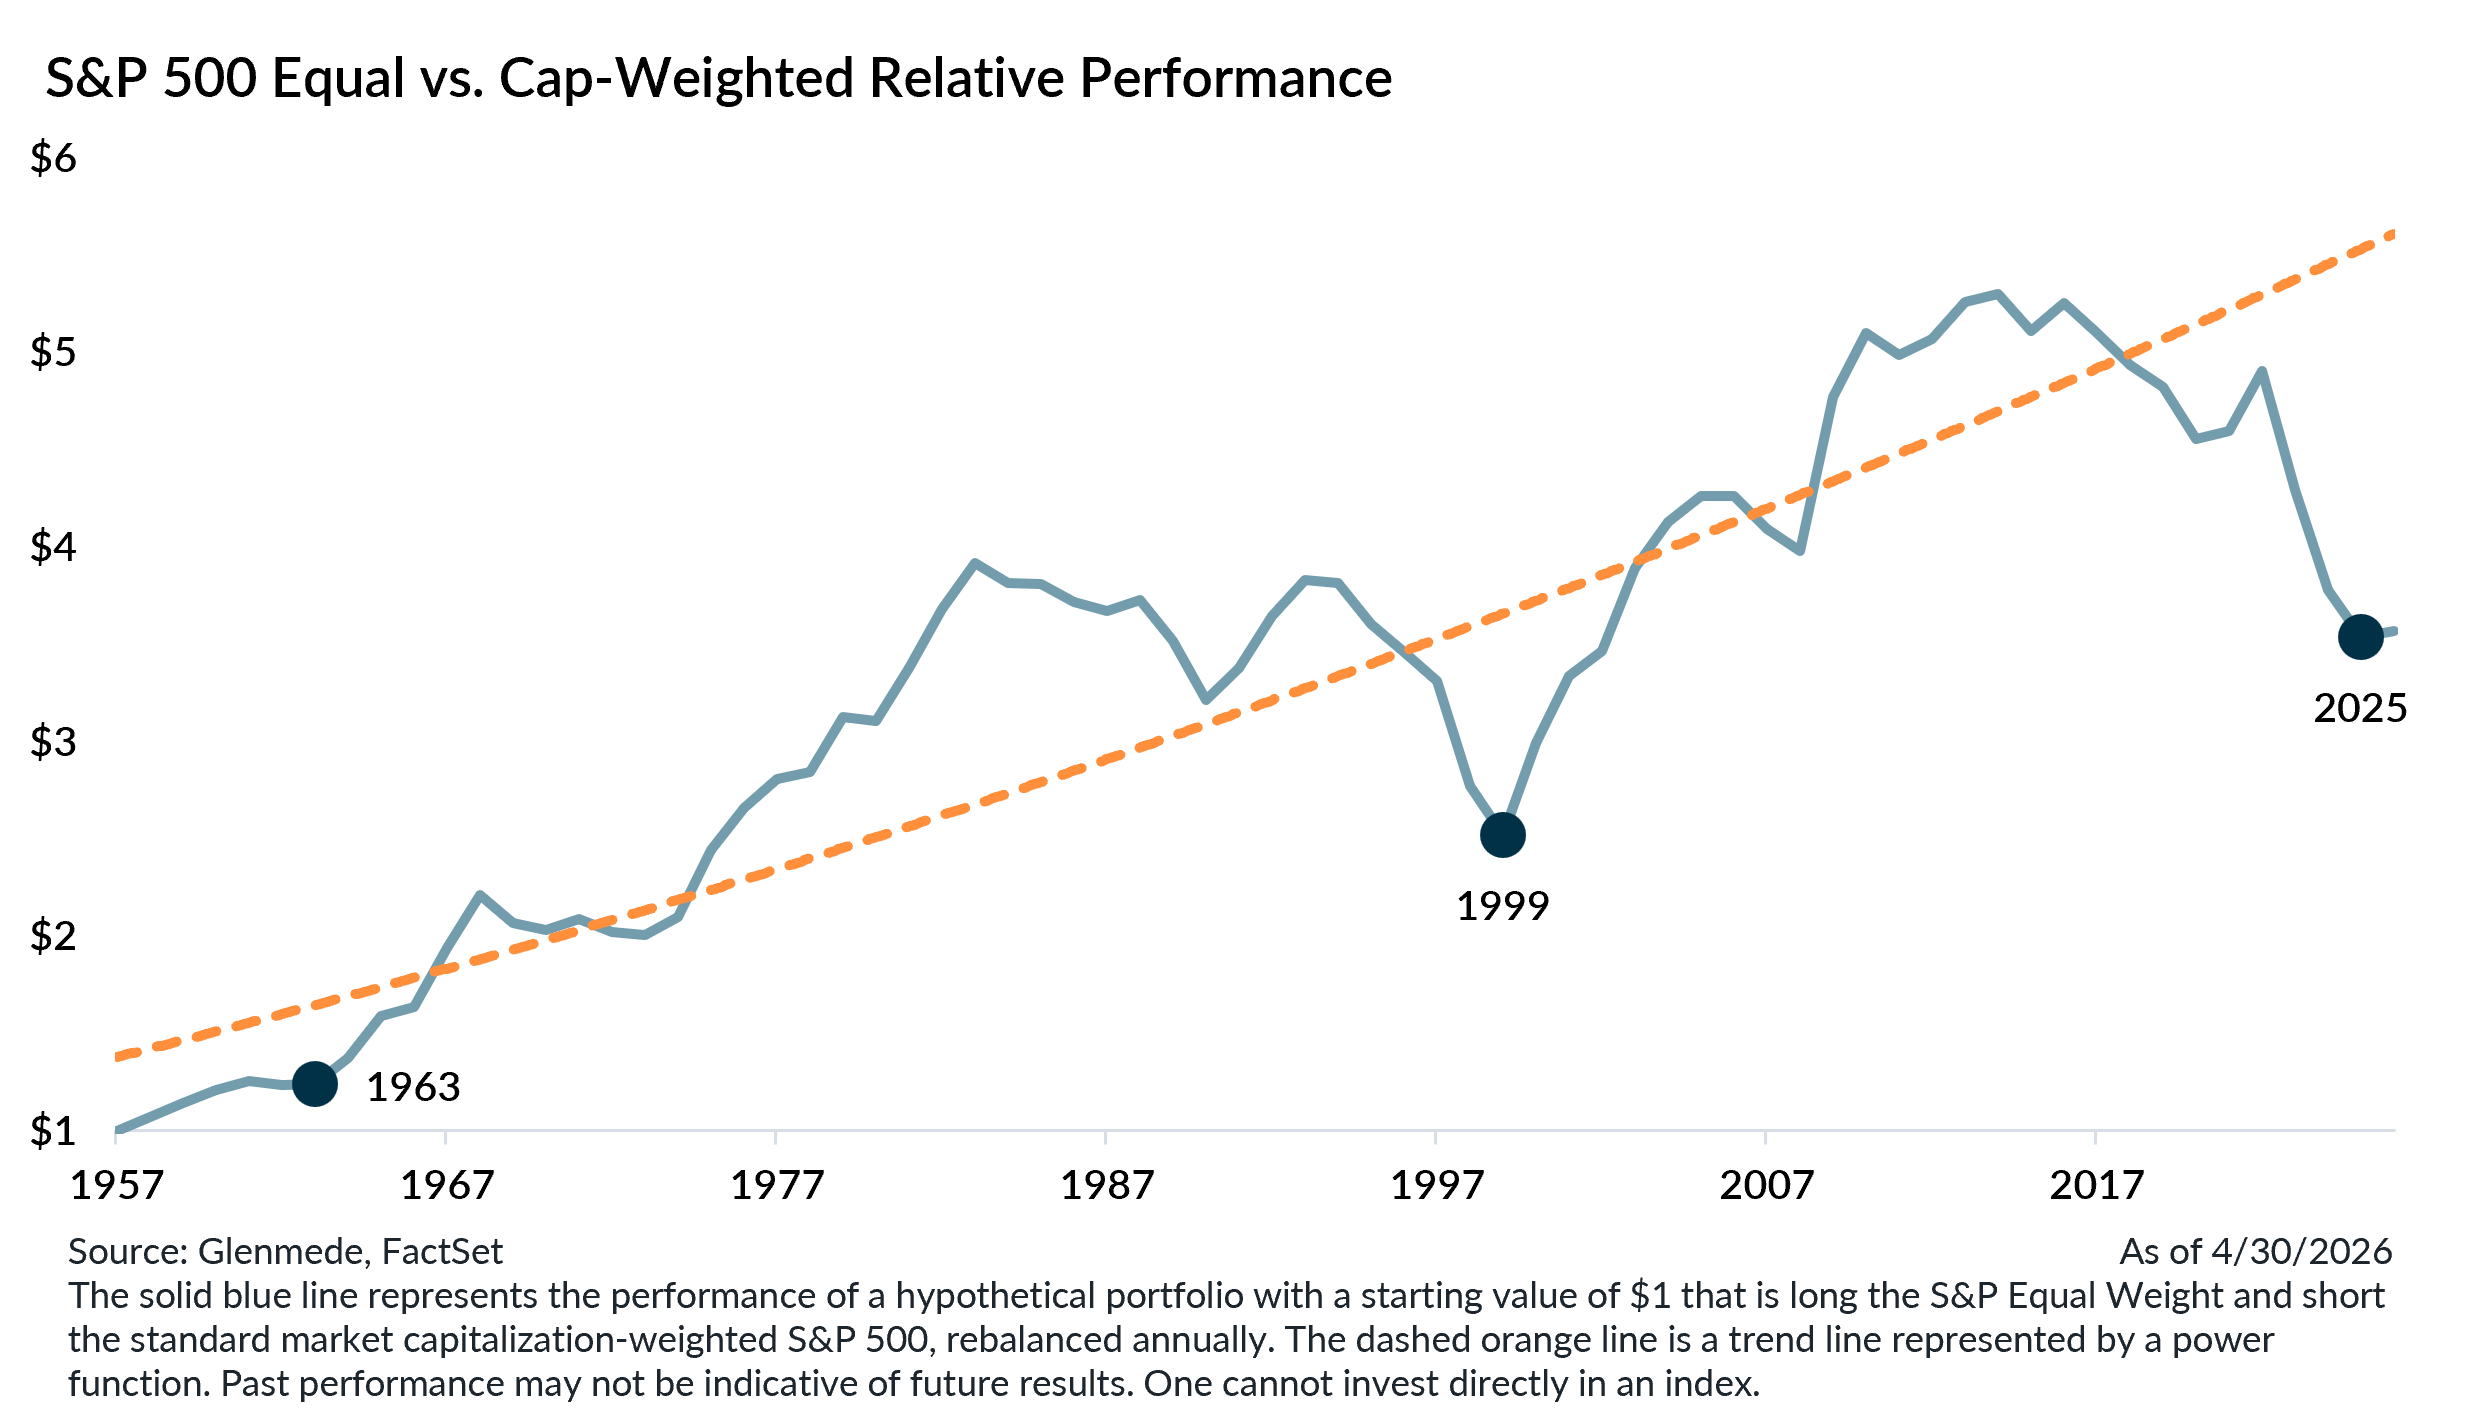
So far this year, market participation has shown early signs of broadening. One of the clearest signals has come from the performance of the “average stock,” often represented by equal-weighted indices. Unlike their traditional cap-weighted counterparts, where the largest companies exert the greatest influence, equal-weighted indices assign the same weight to each constituent. As a result, the S&P 500 Equal Weight provides a more representative view of how typical large cap companies are performing.
Through the first quarter, the S&P 500 Equal Weight had outperformed the S&P 500 by roughly 5% in 2026, among the strongest starts to a year for equal-weight relative performance in decades. April brought a partial reversal, as equal weight gave back most of those gains and the year-to-date advantage narrowed to approximately 1%. Rather than signaling an end to the rotation, that pullback may represent a pause in a broader process. Historically, such transitions have rarely moved in a straight line.
Over longer horizons, the average stock has tended to outperform cap-weighted indices. However, that relationship broke down over the past decade as returns became increasingly concentrated in the largest constituents. Today, the gap between equal-weight and cap-weight performance sits near historical extremes, following a prolonged period of underperformance for the average stock.
Past episodes of similar concentration have often coincided with meaningful inflection points. In the early 1960s and again in the late 1990s, extreme dispersion between cap-weighted and equal-weighted performance was followed by sustained periods of broader market leadership. In both cases, a wider set of companies began to drive returns, and that shift persisted for several years.
While no historical parallel is exact, the current backdrop shares important characteristics with those prior transitions. Narrow leadership, elevated concentration, and extended underperformance of the average stock have historically given way to more balanced market participation, even if the path has not always been direct.
A broader market environment carries important implications. When returns are driven by a wider set of companies, performance becomes less dependent on a small group of mega cap stocks. In turn, the opportunity set across the equity market expands, as a greater number of companies contribute meaningfully to index-level outcomes.
The early months of 2026 offered evidence that leadership may be beginning to broaden beneath the surface. April’s reversal tested that thesis, but a single month of mean reversion does not necessarily interrupt a longer-term process. If the underlying rotation proves durable, this period may ultimately mark the early stages of a more balanced and opportunity-rich phase for U.S. equities.
Val deVassal, CFA
Portfolio Manager, Disciplined Equity, Glenmede Investment Management
Alex Atanasiu, CFA
Portfolio Manager, Disciplined Equity, Glenmede Investment Management
This material was produced by Glenmede Investment Management, LP or its affiliate The Glenmede Trust Company, N.A. (collectively, “Glenmede”) for informational purposes and is not intended as personalized investment advice to purchase, sell or hold any investment or pursue any particular strategy. Opinions and analysis expressed in this material are those of the author or investment team as of the date of preparation and may change without this document being updated. Views expressed do not necessarily reflect the opinions of all investment personnel at Glenmede and may not be reflected in all the strategies and products offered. Forecasts or estimates provided herein, including those related to market outlook are based on research including publicly available information, internally developed data and third-party sources believed to be reliable, but accuracy cannot be guaranteed. Future results may differ significantly depending on market, security specific, economic or political conditions. Charts and graphs provided herein are for illustrative purposes only. Past performance is no guarantee of future results. Indexes mentioned are unmanaged and do not include any expenses, fees or sales charges. It is not possible to invest directly in an index. Any index referred to herein is the intellectual property (including registered trademarks) of the applicable licensor. Any product based on an index is in no way sponsored, endorsed, sold or promoted by the applicable licensor and it shall not have any liability with respect thereto. Financial intermediaries are only permitted to distribute this material in accordance with applicable law and regulation. Such financial intermediaries are required to satisfy themselves that the information in this material is appropriate for any person to whom they provide it. Glenmede shall not be liable for the use or misuse of this material by any such financial intermediary.