The Quarterly Recap Q4 2025: Economic & Market Recap
Executive Summary:
- The U.S. economy showed signs of continued resilience, even as government data disruptions and lingering policy uncertainty limited confidence in major economic indicators.
- As Congress worked to resolve the longest government shutdown in U.S. history, the Federal Reserve eased policy through rate cuts and a return to balance sheet expansion.
- AI-driven concentration continued to anchor equity returns in Q4, though international equities outperformed. Bond markets benefited from unusually low interest rate volatility.
- Above-trend growth expectations, a Fed nearer neutral, and supportive fiscal dynamics define the 2026 outlook, even as valuation dispersion, AI capex risks, and credit market vulnerabilities remain in focus.
Economic Stability Amid Impaired Visibility
The U.S. economy appeared to hold up reasonably well through the end of 2025, though reduced visibility from government data blackouts made real-time assessments more challenging. In the absence of official employment and inflation releases, investors leaned on alternative indicators such as state-level jobless claims and purchasing managers’ indexes to gauge underlying economic conditions. Even after the longest government shutdown in U.S. history came to an end, its effects lingered in the form of delayed and distorted data releases. For example, the November Consumer Price Index report was unusually noisy, reflecting the Bureau of Labor Statistics’ efforts to reconstruct inflation trends after sampling only part of November and skipping October entirely. While both headline and core inflation slowed, those results were met with skepticism given lingering data-quality concerns. As for the labor market, the unemployment rate ticked up to 4.6%, though a lower response rate and other technical factors suggested the error terms around that estimate may have been higher than usual.
After a few turbulent quarters, trade policy saw only modest adjustments in Q4. The highlights included a trade agreement with Switzerland, the imposition of new tariffs on imported trucks, and a détente with China that led to reduced tariffs and the postponement of certain export controls on rare earth materials. In parallel, the Supreme Court heard oral arguments on the administration’s use of emergency powers to enact its tariff agenda, with a ruling expected in early 2026.
The October truce between Israel and Palestine marked a significant de-escalation from two years of intense conflict, reducing a major geopolitical risk premium in global markets. Meanwhile, tensions flared in the Western Hemisphere as the U.S. moved to blockade and seize Venezuelan oil tankers.
From Shutdown to Rate Cuts
Congress spent much of Q4 grappling with efforts to resolve the longest federal government shutdown in U.S. history. After 43 days, lawmakers reached an agreement to reopen the government and fund federal operations through at least January 2026, pushing several major fiscal decisions into the new year. Glenmede estimates that reduced federal spending, government services, and employee compensation likely shaved roughly 1.5% off Q4 GDP, though most of that impact is expected to be recovered in subsequent quarters.
The Federal Reserve cut rates twice in quarter-point increments, bringing the fed funds rate closer to neutral. It also formally ended its quantitative tightening program and resumed balance sheet growth, citing the need to support ongoing economic activity and address elevated pressures in money markets. Alongside these actions, speculation intensified around potential candidates to succeed the current Fed chairman, though no official announcements were made.
A Bull Market, Continued
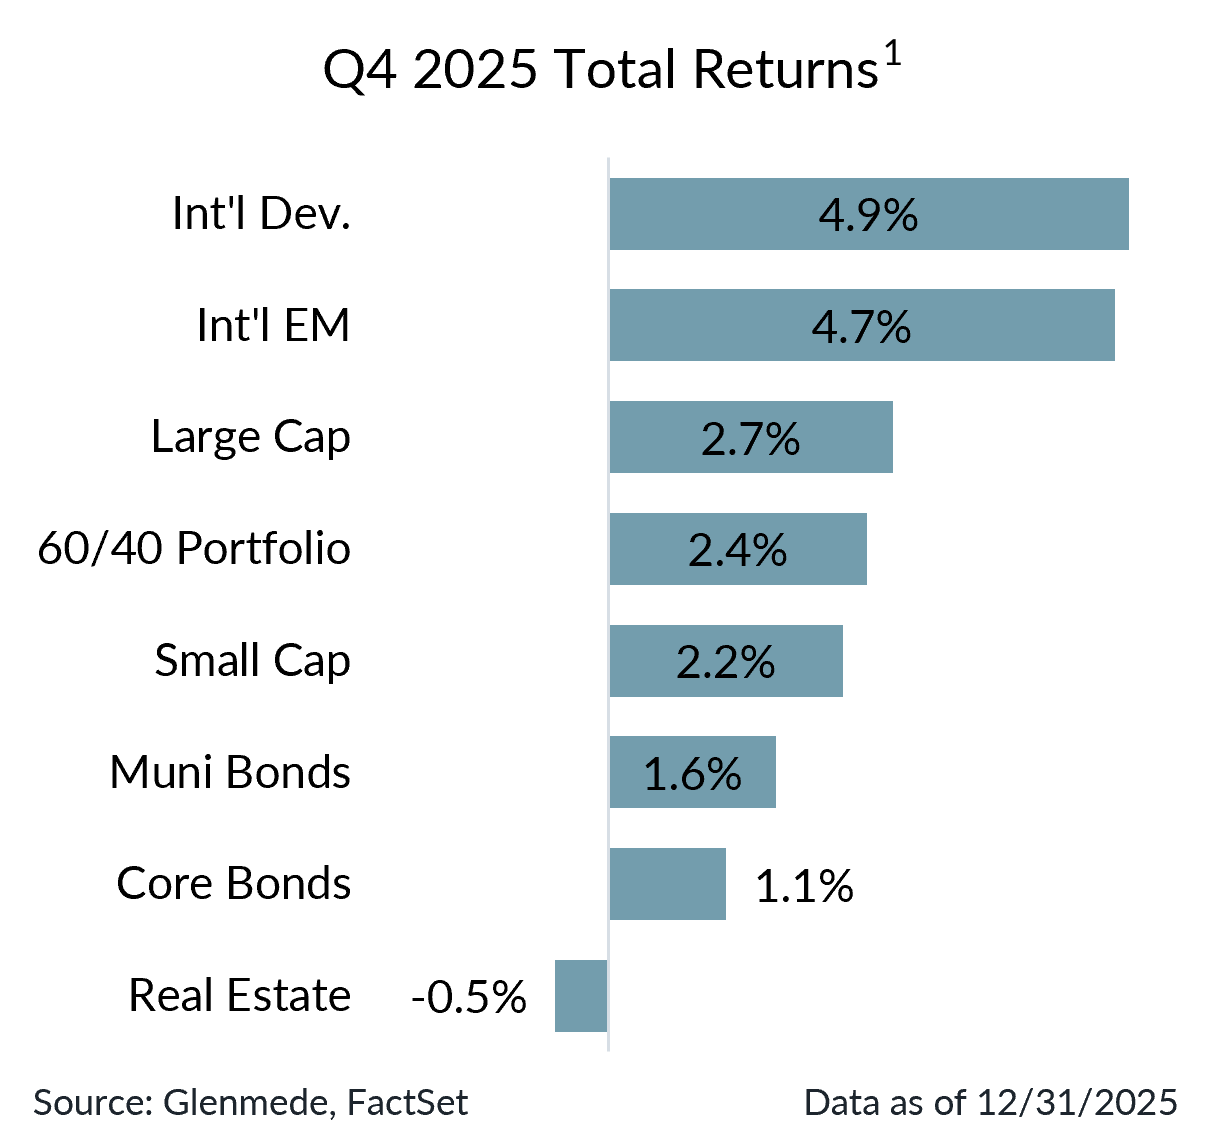
The bull market across most major asset classes continued into Q4. Within U.S. large cap equities, the AI theme remained the dominant force shaping market psychology, with hyperscalers and adjacent beneficiaries continuing to attract attention. Optimism around massive investments in datacenters and compute capacity reinforced the perception of AI as a durable secular growth engine. That enthusiasm became more nuanced later in the quarter, as investors increasingly scrutinized rising leverage, potential overcapacity, the role of vendor financing, and circular demand dynamics. Even so, markets remained concentrated, with the largest seven companies growing to represent more than 35% of the S&P 500 by quarter end. In fact, those seven companies in total now eclipse the size of all large, mid, and small cap stocks in Europe and Japan combined. International stocks outpaced U.S. equities, led by strength in Latin America, South Korea, and Canada.
Fixed Income markets benefitted from an unusually stable interest rate environment. Yields were largely unchanged across most segments. In particular, the yield on 10-year Treasury bonds traded within a narrow 22 bps range for the entirety of Q4. Municipal bonds were even more stable, as investment-grade yields fluctuated by no more than 11 bps over the quarter. In contrast, digital assets experienced significant volatility. Bitcoin declined more than 23% amid growing investor caution toward speculative assets.
Rest of 2025: Top 5 Things to Watch
Above-trend U.S. economic growth appears increasingly likely in the new year as the tariff drag fades, and a combination of fiscal stimulus, AI productivity gains, and potential deregulation support demand. The Fed’s rate cuts at the end of 2025 took monetary policy closer to neutral, raising the bar for additional moves. The Fed is expected to take a wait-and-see approach in 2026, allowing incoming data to clarify whether inflation or labor market conditions warrant further adjustments.
Several risks nonetheless warrant close monitoring. Upside inflation surprises remain possible given the unprecedented scale of late-cycle fiscal stimulus and lingering tariff pass-throughs. At the same time, massive AI-related capital expenditures by the largest technology firms represent a significant bet on future demand, raising the risk that investment could outpace realized returns. In credit markets, a gradual erosion of discipline, particularly within opaque areas such as private credit and off-balance-sheet financing also bears watching.
A constructive growth outlook is tempered by premium valuations in risk assets. However, those premium valuations mask bifurcation beneath the surface, as large cap growth stocks are responsible for the lion’s share of overvaluation. In comparison, small caps trade closer to fair value and may be well-positioned for continued outperformance due to greater interest rate sensitivity and outsized benefits from tax relief. International diversification also remains compelling as shifting trade dynamics improve relative opportunities to hedge predominantly dollar-based portfolios. Fixed income continues to offer fairly-priced yields across most segments, though tight corporate high yield spreads warrant caution and reinforce the need for selectivity.
1Asset classes are represented by the following: Large Cap (S&P 500), Small Cap (Russell 2000), Int’l Dev. (MSCI EAFE), Int’l EM (MSCI EM), Real Estate (FTSE EPRA/NAREIT Developed), Core Bonds (Bloomberg U.S. Aggregate), Muni Bonds (Bloomberg Municipal), 60/40 Portfolio (60% MSCI ACWI, 40% Bloomberg U.S. Aggregate). Past performance may not be indicative of future results. One cannot invest directly in an index.
This material was produced by Glenmede Investment Management, LP or its affiliate The Glenmede Trust Company, N.A. (collectively, “Glenmede”) for informational purposes and is not intended as personalized investment advice to purchase, sell or hold any investment or pursue any particular strategy. Opinions and analysis expressed in this material are those of the author or investment team as of the date of preparation and may change without this document being updated. Views expressed do not necessarily reflect the opinions of all investment personnel at Glenmede and may not be reflected in all the strategies and products offered. Forecasts or estimates provided herein, including those related to market outlook are based on research including publicly available information, internally developed data and third-party sources believed to be reliable, but accuracy cannot be guaranteed. Future results may differ significantly depending on market, security specific, economic or political conditions. Charts and graphs provided herein are for illustrative purposes only. Past performance is no guarantee of future results. Indexes mentioned are unmanaged and do not include any expenses, fees or sales charges. It is not possible to invest directly in an index. Any index referred to herein is the intellectual property (including registered trademarks) of the applicable licensor. Any product based on an index is in no way sponsored, endorsed, sold or promoted by the applicable licensor and it shall not have any liability with respect thereto. Financial intermediaries are only permitted to distribute this material in accordance with applicable law and regulation. Such financial intermediaries are required to satisfy themselves that the information in this material is appropriate for any person to whom they provide it. Glenmede shall not be liable for the use or misuse of this material by any such financial intermediary.