Women in Leadership U.S. Equity

Investment Objective
Maximum long-term total return consistent with reasonable risk to principal.
We seek to create and consistently maintain a strategy with favorable attributes relative to the benchmark index, utilizing unique stock ranking models for each sector, downside risk screens and leading industry group indicators. This strategy invests in companies with significant female representation in leadership that meet at least one of the following criteria: a Chairwoman, a female CEO, women comprising at least 33% of the Board or 33% of senior management, respectively. In addition, the strategy incorporates other gender lens data to help in differentiating companies.
Key Tenets of Our Approach
Key 1
Proprietary, multi-factor stock selection models including gender diversity metrics for each sector
Key 2
Downside risk screens (e.g. earnings surprise indicators, quality of earnings)
Key 3
Leading industry group indicators, integrating top-down and bottom-up metrics
Universe
- Stocks with women in significant leadership roles on the Russell 1000 Index or S&P 500 Index
Benchmark
- Russell 1000 Index
Operating Target
- Typically 60-80 holdings
- Existing position maximum: 4% for any security
- Fully invested: Typically <1% cash
Constraints
- Sector: +/– 3% vs. the benchmark
- Industry group targets: +/– 2% vs. the benchmark
Vehicles
- Separately Managed Accounts






Disciplined Equity Team
Supporting Resources
The S&P 500 Index consists of 500 widely held common stocks. This unmanaged index is a total return index with dividends reinvested.
The Russell 1000 Index is an unmanaged, market value weighted index, which measures performance of the largest 1,000 companies in the market. One cannot invest directly in an index.
This website is for informational purposes only. GIM products are actively managed and their characteristics will vary. All investment has risk, including the risk of loss of principal. There can be no assurance that efforts to manage risk or to achieve any articulated investment objective will be successful. An investor should consider investment objectives, risks, charges and expenses carefully before investing. For additional information regarding risks and about the firm, please refer to Related Literature and Disclosures.
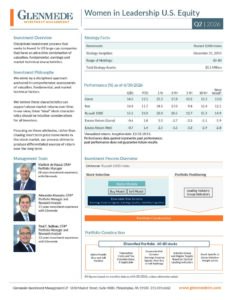
Fact Sheet
Learn More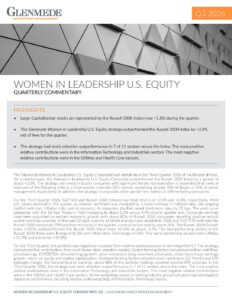
Commentary
Learn MoreThis website is for informational purposes only. GIM products are actively managed and their characteristics will vary. All investment has risk, including the risk of loss of principal. There can be no assurance that efforts to manage risk or to achieve any articulated investment objective will be successful. An investor should consider investment objectives, risks, charges and expenses carefully before investing. For additional information regarding risks and about the firm, please refer to Related Literature and Disclosures.
The S&P 500 Index consists of 500 widely held common stocks. This unmanaged index is a total return index with dividends reinvested.
The Russell 1000 Index is an unmanaged, market value weighted index, which measures performance of the largest 1,000 companies in the market. One cannot invest directly in an index.
Glenmede Investment Management, LP claims compliance with the Global Investment Performance Standards (GIPS®).
GIPS® is a registered trademark of CFA Institute. CFA Institute does not endorse or promote this organization, nor does it warrant the accuracy or quality of the content contained herein.
Glenmede Investment Management, LP, a registered Investment Advisor, is an affiliate of the Glenmede Trust Company, NA (GTC). The “Firm” is defined as all investment advisory accounts managed by Glenmede Investment Management LP. Effective January 1, 2007, the Investment Product Management Group of GTC became Glenmede Investment Management, LP. All performance prior to January 1, 2007, shown here as the performance of GIM, was previously reported as the performance of the Investment Product Management Group of the Glenmede Trust Company.
All of the composites’ valuations and returns are computed and stated in U.S. Dollars. Net numbers are net of max allowable management fee for this strategy. Additional information regarding the Company’s policies for valuing portfolios, calculating performance and preparing compliant presentations, is available upon request. A GIPS® compliant presentation, as well as a complete list of firm composites and performance, can be requested from GIM Client Service at 215.419.6662. Please see the GIPS® presentation for further explanation.
This website is for informational purposes only. GIM products are actively managed and their characteristics will vary. All investment has risk, including the risk of loss of principal. There can be no assurance that efforts to manage risk or to achieve any articulated investment objective will be successful. An investor should consider investment objectives, risks, charges and expenses carefully before investing. For additional information regarding risks and about the firm, please refer to Related Literature and Disclosures.
| Women in Leadership Equity | |
| Number of Holdings | 67 |
| Active Share | 91.5 |
| Wtd Avg. Mkt Cap ($B) | 108.1 |
| P/E | 14.9 |
| P/B | 3.3 |
| ROE | 23.9 |
| EPS Growth (5 yr) | 14.7 |
-
Number of Holdings8.56 67
-
Active Share8.56 91.5
-
Wtd Avg. Mkt Cap ($B)8.56 108.1
-
P/E8.56 14.9
-
P/B8.56 3.3
-
ROE8.56 23.9
-
EPS Growth (5 yr)8.56 14.7
| Lam Research Corporation | 4.53 |
| Hewlett Packard Enterprise Co. | 3.67 |
| Twilio, Inc. Class A | 3.28 |
| F5, Inc. | 3.21 |
| Arista Networks Inc | 3.10 |
| BorgWarner Inc. | 2.89 |
| eBay Inc. | 2.53 |
| Regions Financial Corporation | 2.38 |
| Flex Ltd | 2.32 |
| Expedia Group, Inc. | 2.29 |
| Total | 30.20 |
| Communication Services | 8.56 |
| Consumer Discretionary | 11.37 |
| Consumer Staples | 3.92 |
| Energy | 3.46 |
| Financials | 11.77 |
| Health Care | 10.33 |
| Industrials | 10.31 |
| Information Technology | 31.91 |
| Materials | 2.22 |
| Real Estate | 3.33 |
| Utilities | 1.83 |
| Cash | 0.99 |
-
Consumer Discretionary8.56 11.37
-
Consumer Staples8.56 3.92
-
Energy8.56 3.46
-
Financials8.56 11.77
-
Health Care8.56 10.33
-
Industrials8.56 10.31
-
Information Technology8.56 31.91
-
Materials8.56 2.22
-
Real Estate8.56 3.33
-
Utilities8.56 1.83
-
Cash8.56 0.99
Data as of 3/31/2026. Portfolio characteristics and holdings are subject to change and are provided for informational purposes only. Holdings are not recommendations to buy or sell securities. See Important Disclosures and Definitions.
See Important Disclosures and Definitions.
Source: FactSet and Glenmede calculations, unless otherwise indicated.
The Russell 1000 Index is an unmanaged, market value weighted index, which measures performance of the largest 1,000 companies in the market. One cannot invest directly in an index.
Portfolio holdings are subject to change and may not be representative of current or future investments. Past holdings are not indicative of future results.
Portfolio characteristics, including valuation metrics (P/E, P/B), return measures (ROE), growth rates, and Active Share, are based on third-party data and internal calculations and are subject to change. These metrics are not indicative of future performance.
Active Share: measures the percentage of stock holdings in a manager’s portfolio that differs from the benchmark index. It does not predict performance. Weighted Average Market Cap: total value of all outstanding shares weighted to reflect the portfolio’s positions. Price to Earnings (P/E): ratio of stock price to earnings. Price to Book (P/B): ratio of stock price to per share shareholders’ equity. Return on Equity (ROE): net income divided by equity. 5-Year EPS Growth: reflects annualized trailing five-year historical earnings growth. EPS Growth is not a forecast of future performance.
This material is provided for informational purposes only and does not constitute investment advice or a recommendation to invest in any strategy or security.