Strategic Equity

Investment Objective
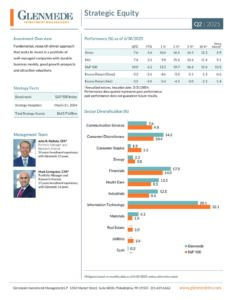
Maximum long term total return consistent with reasonable risk to principal.
The team seeks to invest in well-managed companies with durable business models and sustainable growth prospects at attractive valuations. By constructing a diversified portfolio of such businesses, the team seeks to achieve above-benchmark long-term returns, consistent with reasonable risk, through economic cycles.
For information on the mutual fund, click here.
Key Tenets of Our Approach
Integrate quantitative and fundamental analysis, including use if proprietary quantitative model, to identify opportunities in high quality businesses
Conduct fundamental bottoms-up research to evaluate business models, management, earnings trends and other factors contributing to the opportunities and risks to the business over time
Diversify portfolio across sectors, industries and individual securities
- S&P 500 Index and other large cap stocks
- S&P 500 Index
- Typically 40-50 holdings
- Maximum position size 5% of portfolio
- Cash positions minimal (typically <2%)
- Separately Managed Account
- Mutual Fund
The S&P 500 Index consists of 500 widely held common stocks. This unmanaged Index is a total return index with dividends reinvested. unmanaged.
One cannot invest directly in an index.
This website is for informational purposes only. GIM products are actively managed and their characteristics will vary. All investment has risk, including the risk of loss of principal. There can be no assurance that efforts to manage risk or to achieve any articulated investment objective will be successful. An investor should consider investment objectives, risks, charges and expenses carefully before investing. For additional information regarding risks and about the firm, please refer to Related Literature and Disclosures.
Fact Sheet
Learn More
Commentary
Learn MoreThis website is for informational purposes only and is not a solicitation for any product or service. GIM products are actively managed and their characteristics will vary. All investment has risk, including the risk of loss of principal. There can be no assurance that efforts to manage risk or to achieve any articulated investment objective will be successful. An investor should consider investment objectives, risks, charges and expenses carefully before investing.
Performance quoted is past performance and is not a guarantee of future results. Products have fees that reduce their performance, indexes do not.
Glenmede Investment Management, LP claims compliance with the Global Investment Performance Standards (GIPS®). GIPS® is a registered trademark of CFA Institute. CFA Institute does not endorse or promote this organization, nor does it warrant the accuracy or quality of the content contained herein.
*Prior to 08/30/2022, this composite was known as the Quantitative U.S. Large Cap Socially Responsible Composite.
Investors cannot invest directly in an index.
The Bank of America Merrill Lynch 1-3 US Year Treasury Index is an unmanaged index that tracks the performance of the direct sovereign debt of the U.S. Government having a maturity of at least one year and less than three year.
The CBOE Put/Write T-W Index is a benchmark index designed to track the performance of a hypothetical short put strategy. CBOE introduced the CBOE S&P 500 PutWrite T-W Index on July 3, 2014. The PWT Index replicates the methodology used to calculate the PUT Index, with one exception. That is, on each roll date the SPX puts are deemed to be sold at the Ptwap, a price equal to the time-weighted average of reported bid prices, of the selected SPX put option beginning at 11:30 a.m. ET and ending at 12:00 p.m. ET. Accordingly, Ptwap is used in place of the Pvwap on PWT roll dates. CBOE has not calculated a separate series of historical values for the PWT Index prior to July 3, 2014. Rather, historical values for the PWT Index prior to July 3, 2014, may be considered the same as PUT Index values. The Index is unmanaged.
The FTSE 3 Month US T Bill Index Series is intended to track the daily performance of 3 month US Treasury bills. The indexes are designed to operate as a reference rate for a series of funds. The Index is unmanaged.
The ICE BofA 1 to 3 Year Govt/Agency Index total return comprises price appreciation/depreciation and income as a percentage of the original investment. The Index is market value weighted and is designed to measure the performance of U.S. dollar-denominated, fixed rate securities with minimum term to maturity greater than one year and less than or equal to three years. The Index is unmanaged.
The MSCI All Country World captures large and mid-cap representation across 23 Developed Markets (DM) and 23 Emerging Markets (EM) countries. With 2,480 constituents, the index covers approximately 85% of the global investable equity opportunity set. The Index is unmanaged.
The MSCI World ex US Index is a free float-adjusted market capitalization index that is designed to measure the equity market performance of developed markets, excluding the US. The MSCI World ex US Index consists of the following 22 developed market country indices: Australia, Austria, Belgium, Canada, Denmark, Finland, France, Germany, Hong Kong, Ireland, Israel, Italy, Japan, the Netherlands, New Zealand, Norway, Portugal, Singapore, Spain, Sweden, Switzerland, and the United Kingdom. The Index is unmanaged.
The S&P 500 Index consists of 500 widely held common stocks. This unmanaged Index is a total return index with dividends reinvested.
The Russell 1000 Index is an unmanaged, market value weighted index, which measures performance of the largest 1,000 companies in the market.
The Russell 1000 Growth Index is an unmanaged, market value weighted index, which measures performance of the largest 1,000 companies in the market. Returns include the reinvestment of dividends and other income.
The Russell 1000 Value Index is an unmanaged, market value weighted index, which measures the performance of those 1,000 largest companies in the Russell 3000 Index with lower price-to-book ratios and lower forecasted growth values.
The Russell 2000 Index is an unmanaged, market value weighted index, which measures performance of the 2,000 companies that are between the1,000th and 3,000th largest in the market.
The Russell 3000 Index is an unmanaged market value weighted index with dividends reinvested, which measures performance of the 3,000 largest companies in the market.
View Mutual Fund performance here.
This website is for informational purposes only and is not a solicitation for any product or service. GIM products are actively managed and their characteristics will vary. All investment has risk, including the risk of loss of principal. There can be no assurance that efforts to manage risk or to achieve any articulated investment objective will be successful. An investor should consider investment objectives, risks, charges and expenses carefully before investing.
Performance quoted is past performance and is not a guarantee of future results. Products have fees that reduce their performance, indexes do not.
Glenmede Investment Management, LP claims compliance with the Global Investment Performance Standards (GIPS®). GIPS® is a registered trademark of CFA Institute. CFA Institute does not endorse or promote this organization, nor does it warrant the accuracy or quality of the content contained herein.
*Prior to 08/30/2022, this composite was known as the Quantitative U.S. Large Cap Socially Responsible Composite.
Investors cannot invest directly in an index.
The Bank of America Merrill Lynch 1-3 US Year Treasury Index is an unmanaged index that tracks the performance of the direct sovereign debt of the U.S. Government having a maturity of at least one year and less than three year.
The CBOE Put/Write T-W Index is a benchmark index designed to track the performance of a hypothetical short put strategy. CBOE introduced the CBOE S&P 500 PutWrite T-W Index on July 3, 2014. The PWT Index replicates the methodology used to calculate the PUT Index, with one exception. That is, on each roll date the SPX puts are deemed to be sold at the Ptwap, a price equal to the time-weighted average of reported bid prices, of the selected SPX put option beginning at 11:30 a.m. ET and ending at 12:00 p.m. ET. Accordingly, Ptwap is used in place of the Pvwap on PWT roll dates. CBOE has not calculated a separate series of historical values for the PWT Index prior to July 3, 2014. Rather, historical values for the PWT Index prior to July 3, 2014, may be considered the same as PUT Index values. The Index is unmanaged.
The FTSE 3 Month US T Bill Index Series is intended to track the daily performance of 3 month US Treasury bills. The indexes are designed to operate as a reference rate for a series of funds. The Index is unmanaged.
The ICE BofA 1 to 3 Year Govt/Agency Index total return comprises price appreciation/depreciation and income as a percentage of the original investment. The Index is market value weighted and is designed to measure the performance of U.S. dollar-denominated, fixed rate securities with minimum term to maturity greater than one year and less than or equal to three years. The Index is unmanaged.
The MSCI All Country World captures large and mid-cap representation across 23 Developed Markets (DM) and 23 Emerging Markets (EM) countries. With 2,480 constituents, the index covers approximately 85% of the global investable equity opportunity set. The Index is unmanaged.
The MSCI World ex US Index is a free float-adjusted market capitalization index that is designed to measure the equity market performance of developed markets, excluding the US. The MSCI World ex US Index consists of the following 22 developed market country indices: Australia, Austria, Belgium, Canada, Denmark, Finland, France, Germany, Hong Kong, Ireland, Israel, Italy, Japan, the Netherlands, New Zealand, Norway, Portugal, Singapore, Spain, Sweden, Switzerland, and the United Kingdom. The Index is unmanaged.
The S&P 500 Index consists of 500 widely held common stocks. This unmanaged Index is a total return index with dividends reinvested.
The Russell 1000 Index is an unmanaged, market value weighted index, which measures performance of the largest 1,000 companies in the market.
The Russell 1000 Growth Index is an unmanaged, market value weighted index, which measures performance of the largest 1,000 companies in the market. Returns include the reinvestment of dividends and other income.
The Russell 1000 Value Index is an unmanaged, market value weighted index, which measures the performance of those 1,000 largest companies in the Russell 3000 Index with lower price-to-book ratios and lower forecasted growth values.
The Russell 2000 Index is an unmanaged, market value weighted index, which measures performance of the 2,000 companies that are between the1,000th and 3,000th largest in the market.
The Russell 3000 Index is an unmanaged market value weighted index with dividends reinvested, which measures performance of the 3,000 largest companies in the market.