The Quarterly Statement Q2 2023: Concentration… 64… No Repeats… Or Hesitation…
Market Review Second Quarter 2023
What We Know: Second Quarter 2023 Recap
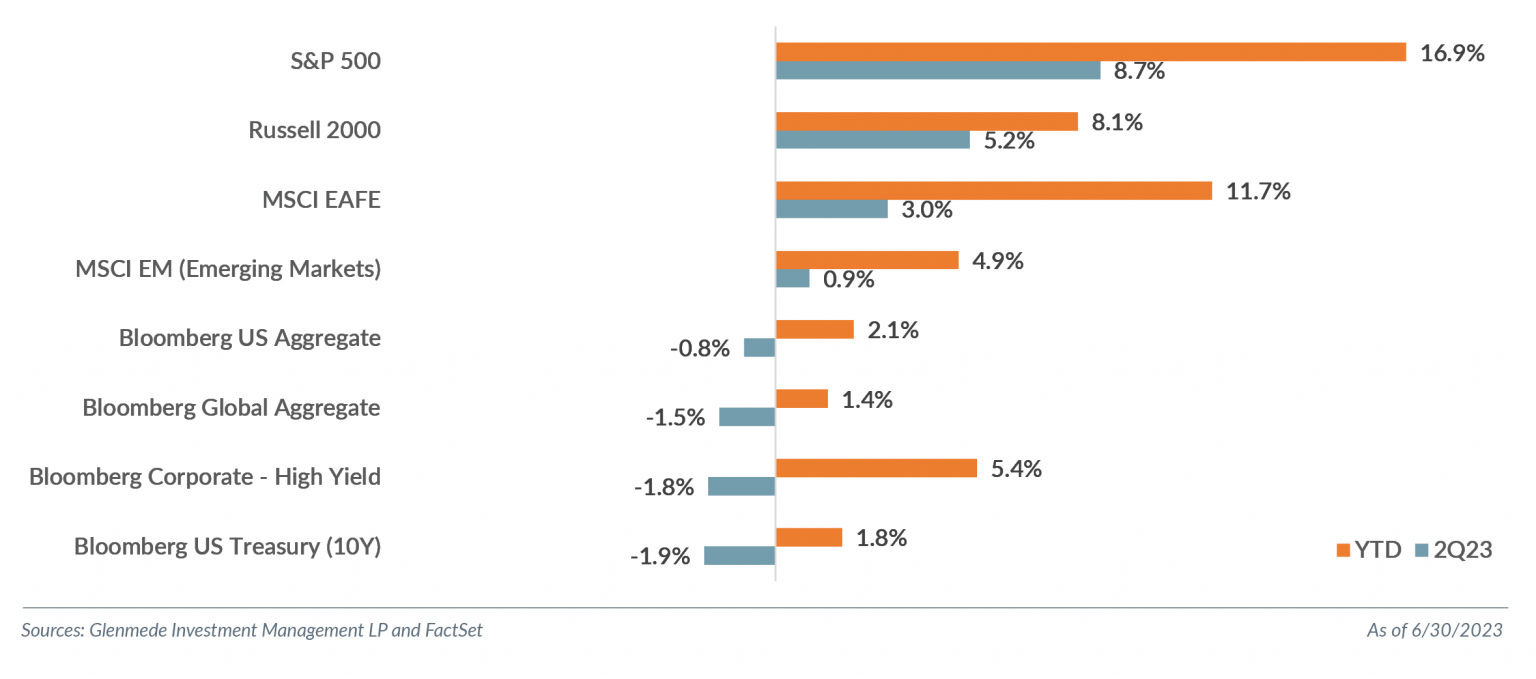
Equity markets continued their rally in the second quarter, with the focus remaining on mega cap stocks. The Nasdaq 100 was the standout index performer with a 15.4% rally, bringing the year-to-date return to nearly 40%, a record first-half performance. The S&P 500 posted its third consecutive quarter of positive returns with an 8.7% rally for a YTD return of 16.9%. The “Magnificent Seven” (Apple Inc., Microsoft Corporation, Alphabet Inc., Amazon.com, Inc., NVIDIA Corporation, Tesla, Inc. and Meta Platforms, Inc.), as these stocks have been dubbed, accounted for almost two-thirds of the S&P 500 Index’s quarterly gains.
The mega cap stock performance helped drive large cap growth, leading to the second largest first-half outperformance over large cap value since the inception of the Russell Value and Growth indices in 1979, behind the COVID rally in first-half 2020. The Russell 1000 Value Index returned 4.1% in Q2 and the Russell 1000 Growth Index, 12.8%, bringing YTD total returns to 5.1% and 29.0%, respectively.
With a push from the mega cap stocks, the Information Technology sector led the S&P 500 with a 17.2% return in Q2 and an impressive 42.8% YTD. Consumer Discretionary realized the second-best sector return at 14.6%, bringing the YTD total to 33.0%, followed by Communication Services with 13.1% and 36.2% YTD. Utilities and Energy were the only down sectors for the quarter with declines of 2.5% and 0.9%, respectively.
Small cap (Russell 2000 Index) had a bit of a bounce this quarter with a 5.2% return, although it continues to trail its large cap counterparts with a YTD return of 8.1%. Small cap value (Russell 2000 Value Index) underperformed growth (Russell 2000 Growth Index) 3.2% versus 7.1%.
International markets, while still positive, did not outpace domestic markets this quarter. Developed international (MSCI EAFE Index) returned 3.0%, and international emerging markets (MSCI Emerging Markets Index), 0.9%.
Volatility took a breather for the first time in over three years. The Cboe Volatility Index (VIX) closed below 13.0 for the first time since mid-February 2020. The VIX averaged 16.5 in Q2, the lowest quarterly average since COVID and below the longer-term average of 19.7 since 1990.
With the regional banking concerns moving to the background, recession concerns failing to materialize, strong job data and stubborn inflation, the focus returned to central banks. As noted in our Q1 2023 Quarterly Statement, the fed funds futures were pricing in one more hike and then potential cuts into year end, something we thought seemed inconsistent with other market reactions. This quarter, the Fed hiked 25 basis points in May and paused in June, but the shift from a possible rate cut environment to a more hawkish one raised concerns of a potential policy mistake. The U.S. Treasury curve bear flattened, with the U.S. Treasury 2Y yield increasing 80bps to 4.90% and the U.S. Treasury 10Y yield increasing 37bps to 3.84%. The U.S. Treasury 10Y-2Y yields, a much-watched recessionary indicator, inverted by over 100bps, a level briefly touched during the regional banking crisis in Q1 but otherwise not seen since the 1980s. Fixed income strategies had mixed returns in Q2.
What We Debate: A Practitioner’s Perspective — Concentration
“Concentration… 64… No Repeats… or Hesitation...” — Lyrics to Concentration 64
The word for the first half of the year, in our view, undoubtedly was “concentration.” Concentration was used so often in the financial media that it started to sound lyrical, reminiscent of the popular schoolyard game Concentration 64. For those of us who did not have to endure such games on long car rides, the game involves singing a song, clapping and naming new categories: “Concentration (3x clap)… Sixty-four (3x clap)… No repeats (3x clap)… Or hesitation (3x clap).”[1]
Using this rhyme as a way to frame our conversation, we discuss the unprecedented market concentration in broad-based indices and offer insight into what we debate about this concentration.
Concentration (3x clap)…
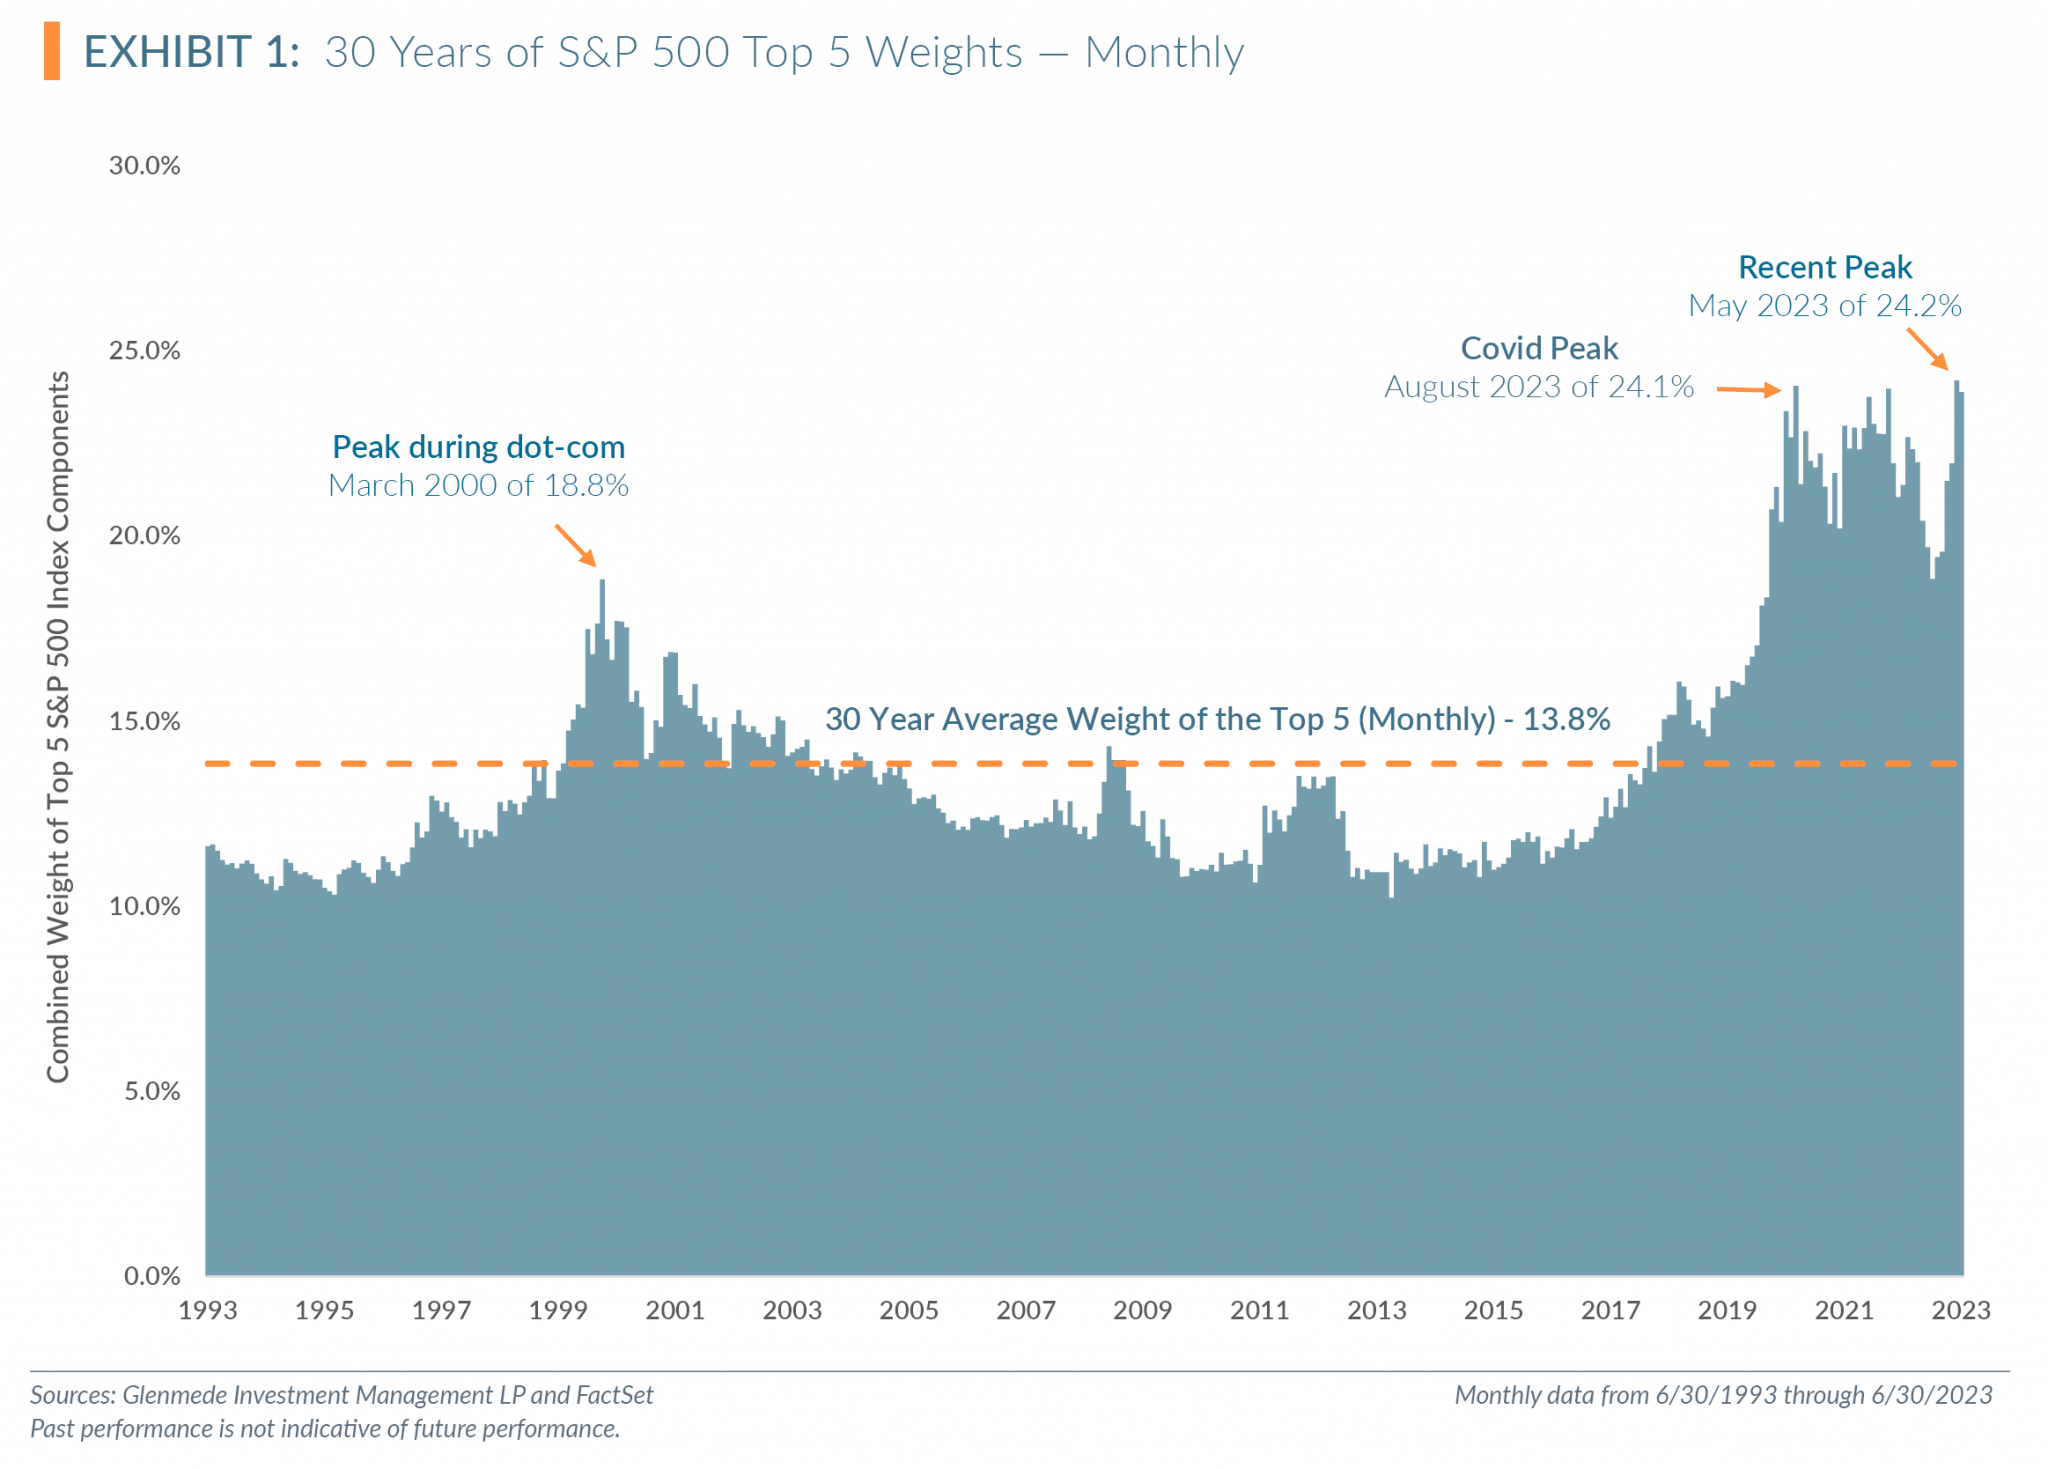
Market concentration is at levels not seen in several decades. When comparing monthly data over the past 30 years, the S&P 500 topped its peak concentration from the COVID period to end May 2023 with a weighting of 24.2% for the top five components, as shown in Exhibit 1. This is almost twice the average of 13.8% for the top five weightings over the past 30 years.
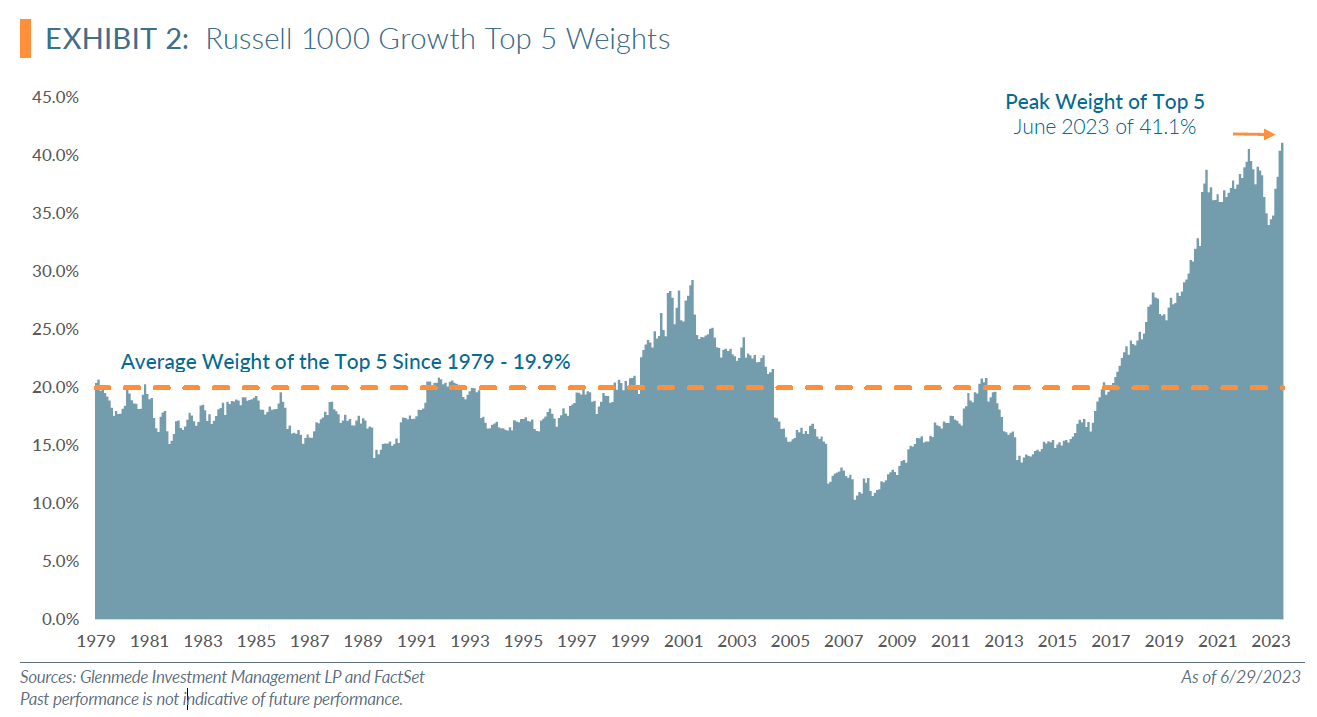
The top five weighted S&P 500 component stocks at the end of the quarter were Apple, Microsoft, Amazon, NVIDIA and Alphabet Inc., which were also in the Russell 1000 Growth Index. While roughly 1% of the constituents that comprise the S&P 500 have a weighting of 23.9% as of June 30, the Russell 1000 Growth Index is even more concentrated, with the top five representing about 0.5% of the component stocks and a 41.1% weighting of the index, a peak not seen since the data’s inception in 1979 (Exhibit 2). The current concentration is more than double the average weight of the top five components since 1979 of 19.9%.
64 (3x clap)…
Sticking with our Concentration 64 theme, where does the number 64 come into play? Exhibit 3 charts the weights of the top two and top five constituents of the S&P 500 on an annual basis starting in …. yes, 1964.
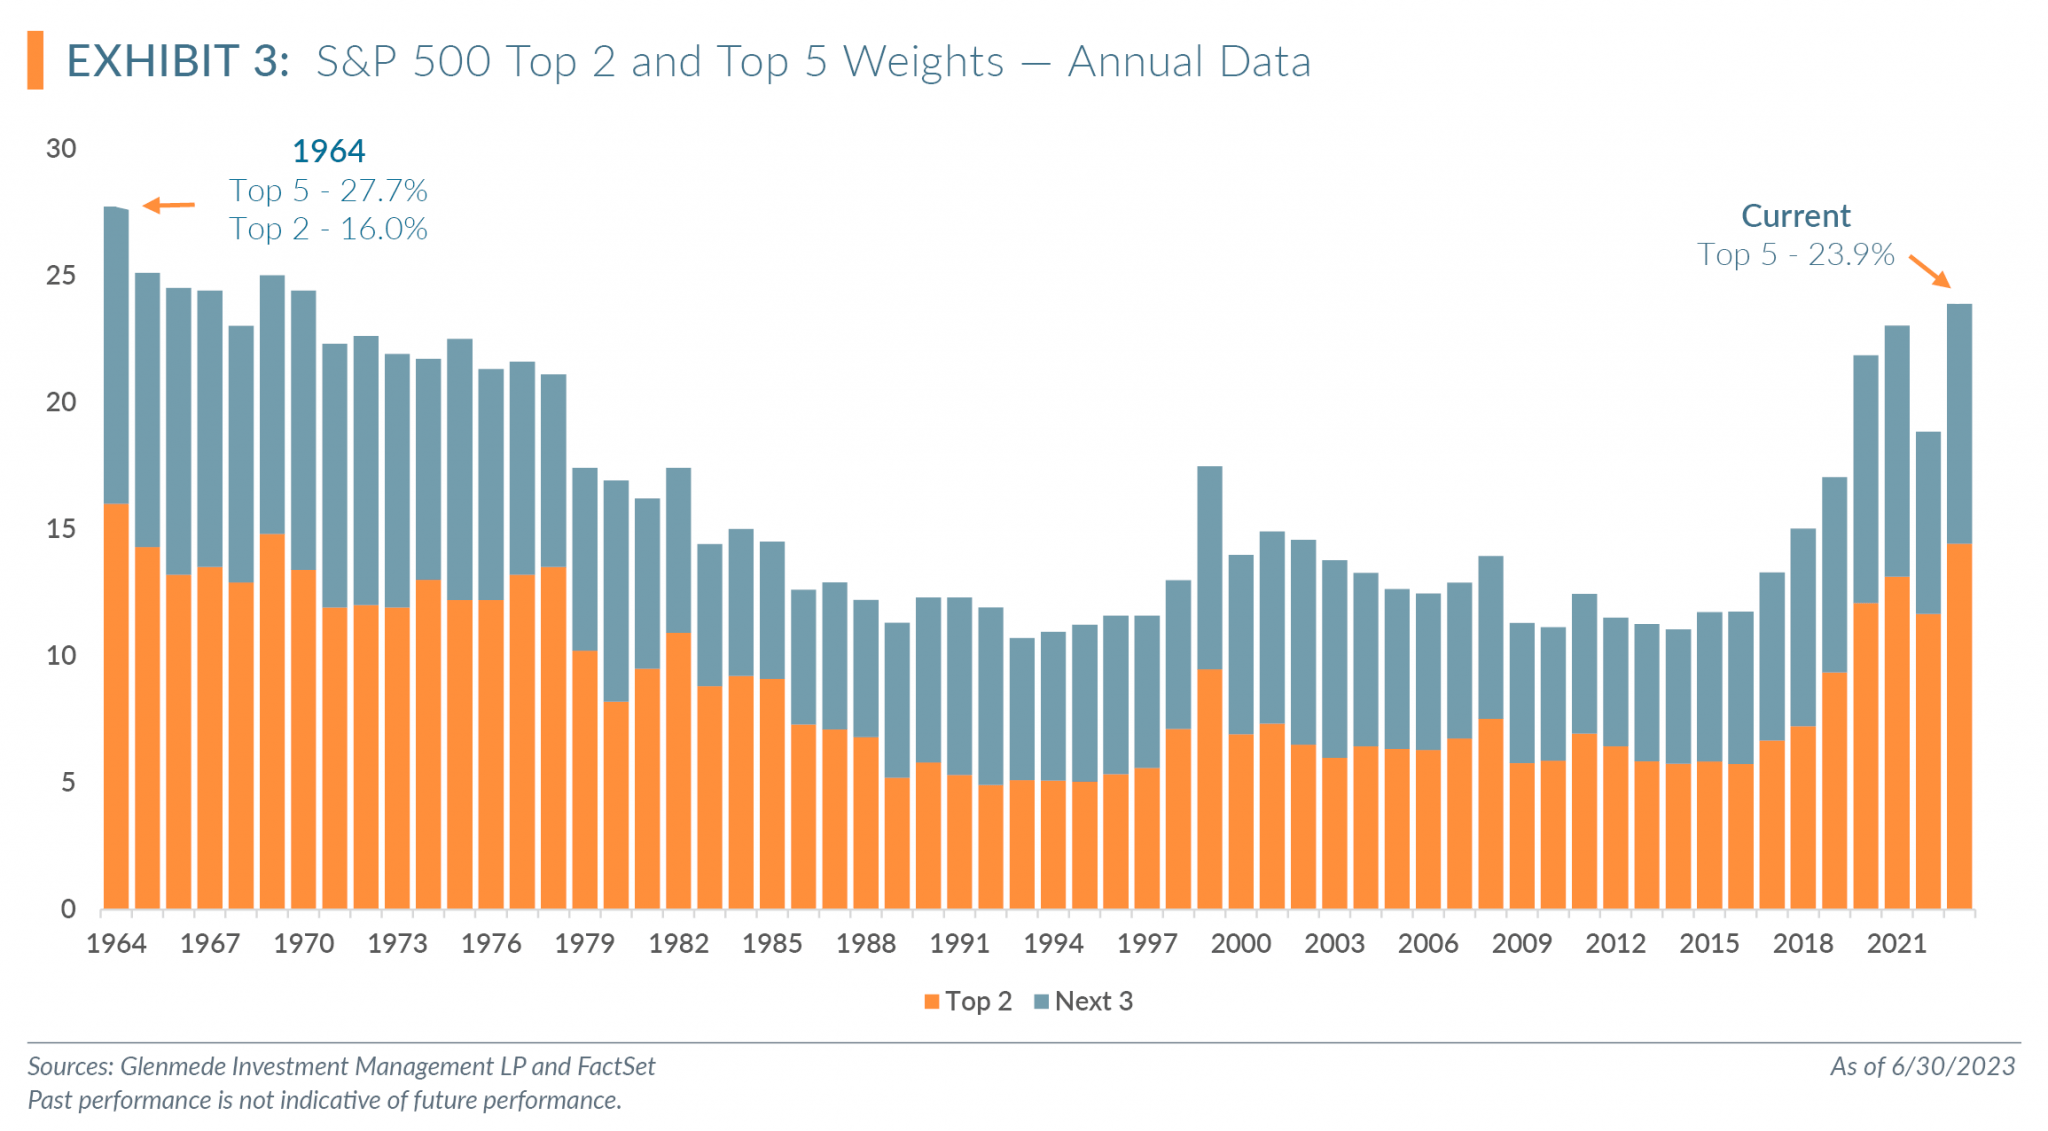
As noted previously, while the S&P 500 is more concentrated than it has been in 30 years, the index has seen higher concentration. While it took just over five years for the market concentration during the dot-com period to consistently return to prespike levels below 13%, the previous periods of concentration in the 1960s and 1970s took 17 years before the “new normal” in the mid-teens was reached. One notable difference between the concentration of the top five constituents in the 1960s and 1970s versus today is the diversification of sectors in the top holdings. While the index had higher concentration levels in the 1960s and 1970s, the top five stocks represented several sectors, with some diversification, unlike the current concentration of only technology-related stocks. Additionally, we can argue the economy was different and indexing was a more novel concept; however, we cannot debate that the index has never been more concentrated. We can comfortably say that we expect the concentration to normalize over time, but defining that time period to normalization is more difficult.
No Repeats (3x clap)…
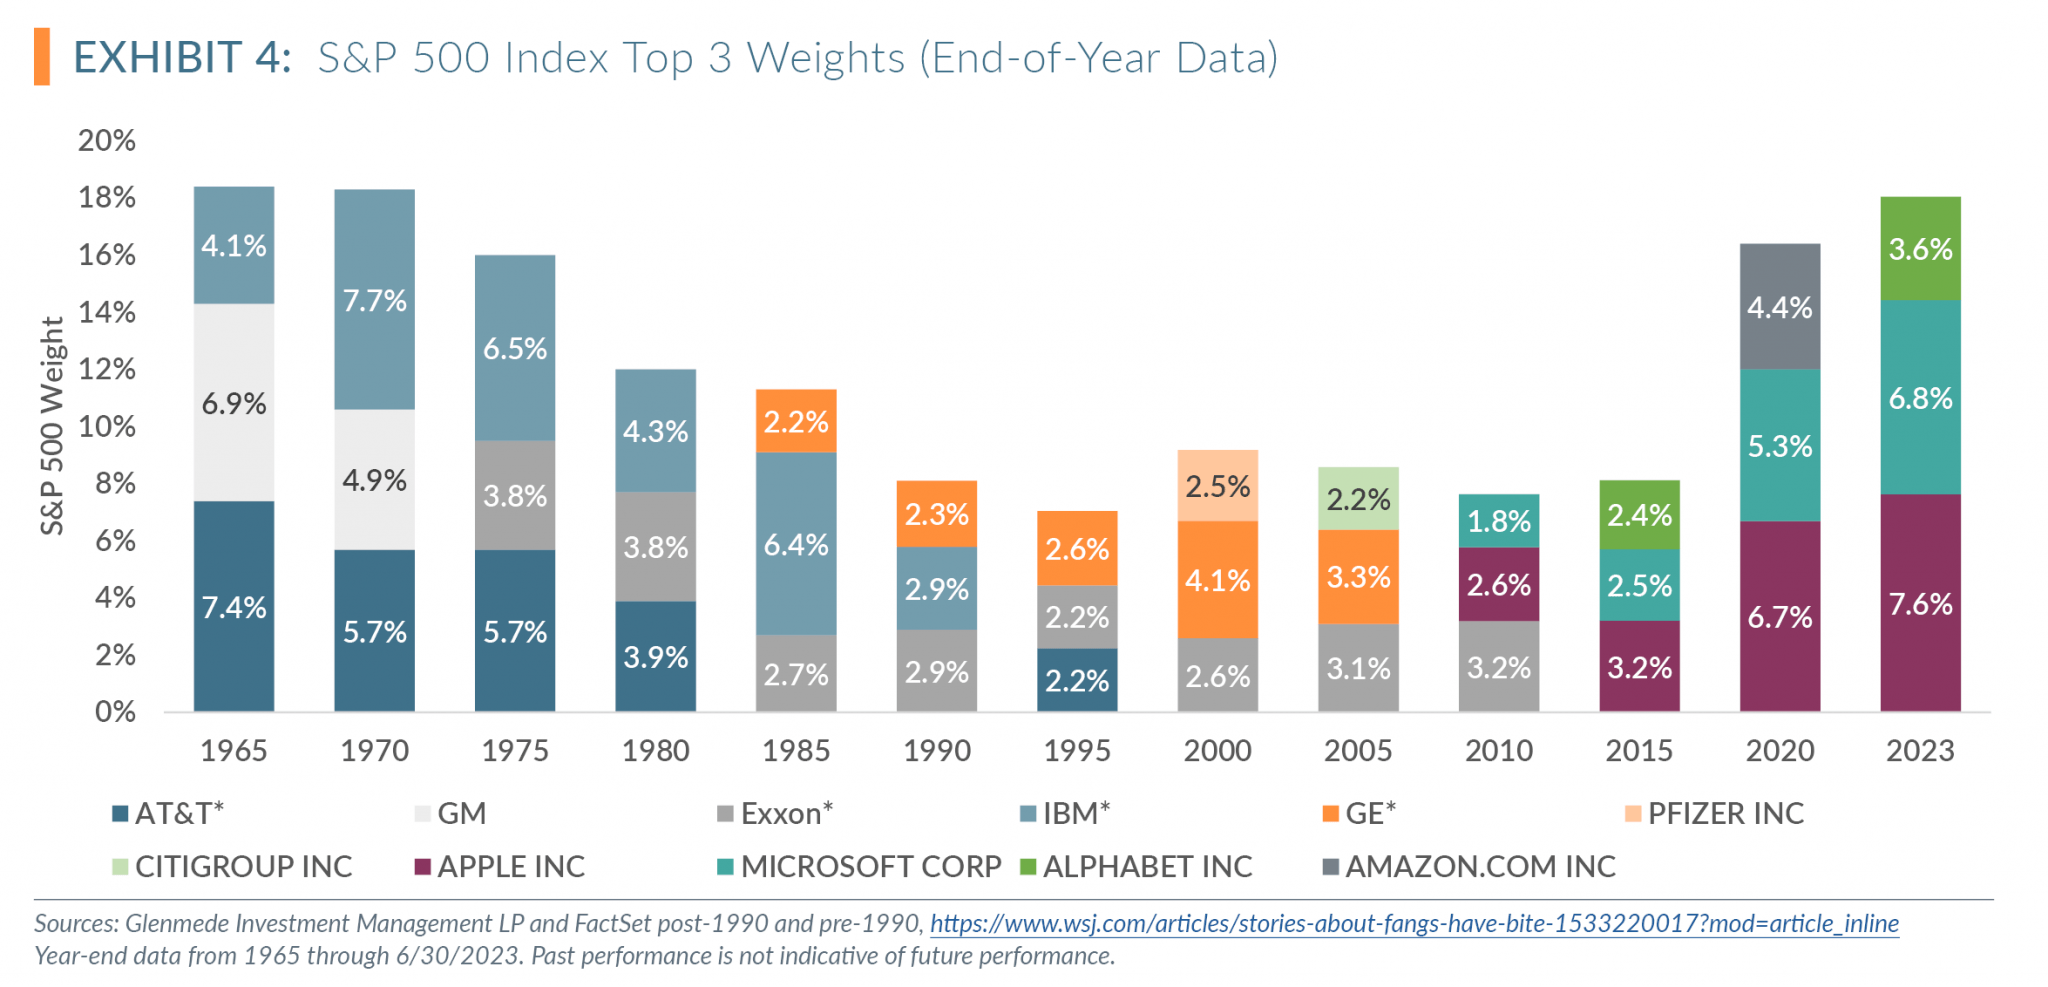
While the S&P 500 has been concentrated from time to time, the most concentrated stocks generally have not repeated in those cycles. Exhibit 4 compares the top three weighted constituents over five-year periods starting in 1965. We focused on the top three because we believe it is easier to see trends of concentration as names emerge and disappear. We used five-year periods for similar reasons: Trends are evident and noise in the data is minimized.
As shown in Exhibit 4, historically most top weights appeared on the list, remained for several five-year cycles, and then disappeared from the top three. A notable exception is AT&T, a top weight for much of the 1960s and 1970s only to disappear amidst increased antitrust and regulatory scrutiny in the 1980s and then reappear briefly in 1995 at the start of the tech boom.
Over the past 60 years, as shown in Exhibit 5, 18 companies have been in the top three weights[2] of the S&P 500 with varying stays. The notable standouts are Exxon Mobil Corporation, AT&T Inc. and Microsoft. When including company mergers, Exxon Mobil enjoyed the longest tenure on the top three list: It was a top three weight for 40 and a top five weight for 52 of the past 60 years. AT&T was a top weight for 22 of the past 60 years, 19 consecutive years until 1982 (prior to regulatory interest), and then under a new name (AT&T Corp.) briefly for three years in the 1990s. The only other company to come in and out of the top three weights multiple times is Microsoft, though its breaks in between have been shorter than a decade. Microsoft has been in the top three for 21 of the past 27 years.
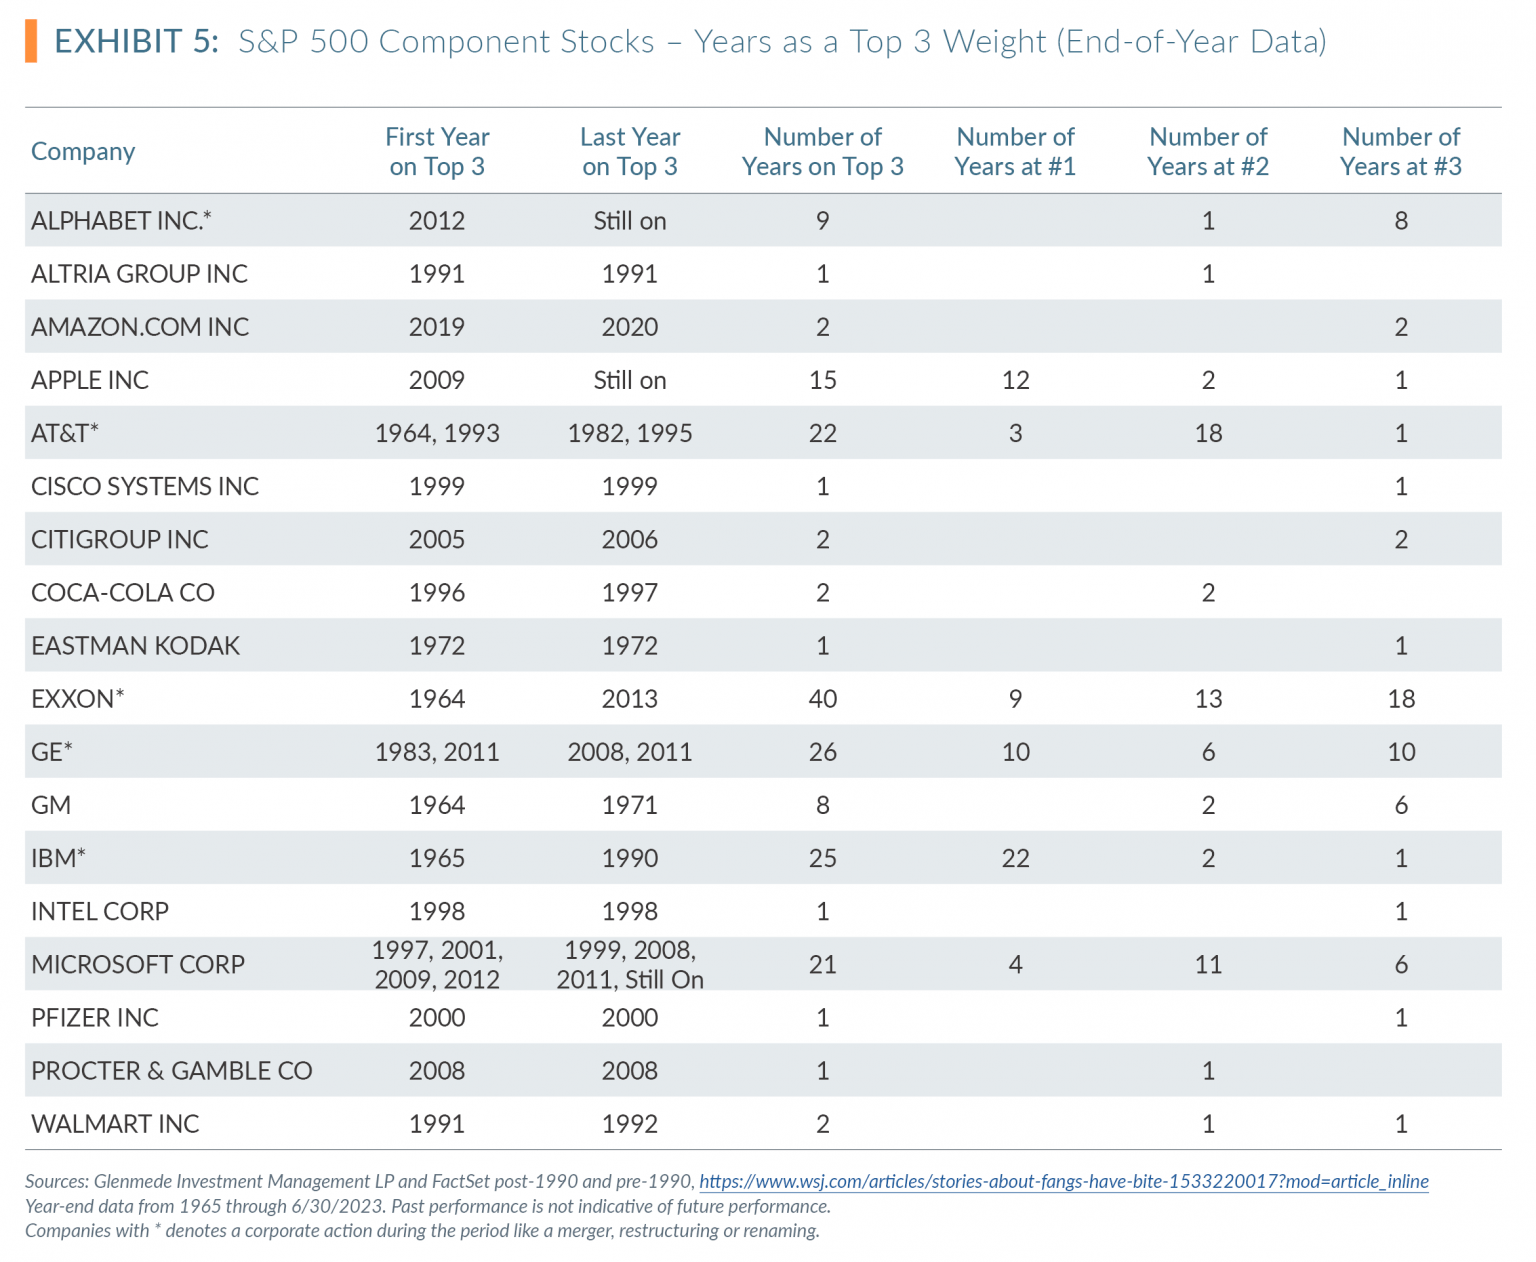
The historical range of time for a company to remain at top three weight is 40 years (Exxon Mobil) to 1 year (several companies), with the average of 10 but a median of 2. The current top three weights of Apple, Microsoft and Alphabet have been top three weights for 15, 21 and 9 years, respectively.
No Hesitation (3x clap)…
Our hesitation to allocate to the passive indices in the current environment focuses on valuation and concentration. We have no hesitation in stating our belief that while market cap-based indices may offer a reasonable representation of the broader stock market performance over time, their structure creates risks for investors because the companies with the highest weights have the highest market caps. To maintain those overweights relative to an equal weighted index, those companies’ future earnings growth will need to exceed other constituents or multiples will need to expand before earnings materialize, resulting in potentially expensive companies on a relative value basis. While history shows that certain companies may dominate market returns for extended periods, ultimately new dominant companies emerge. A recent Innosight study[3] showed the average tenure of an S&P 500 constituent was 30-35 years in the 1970s but 15-20 years by the 2010s. Expectations are for that tenure to decline further amidst continued innovation. The cyclicality of stocks coming and going from the index could create volatility and leave passive indices more exposed to volatility of valuation fluctuations.
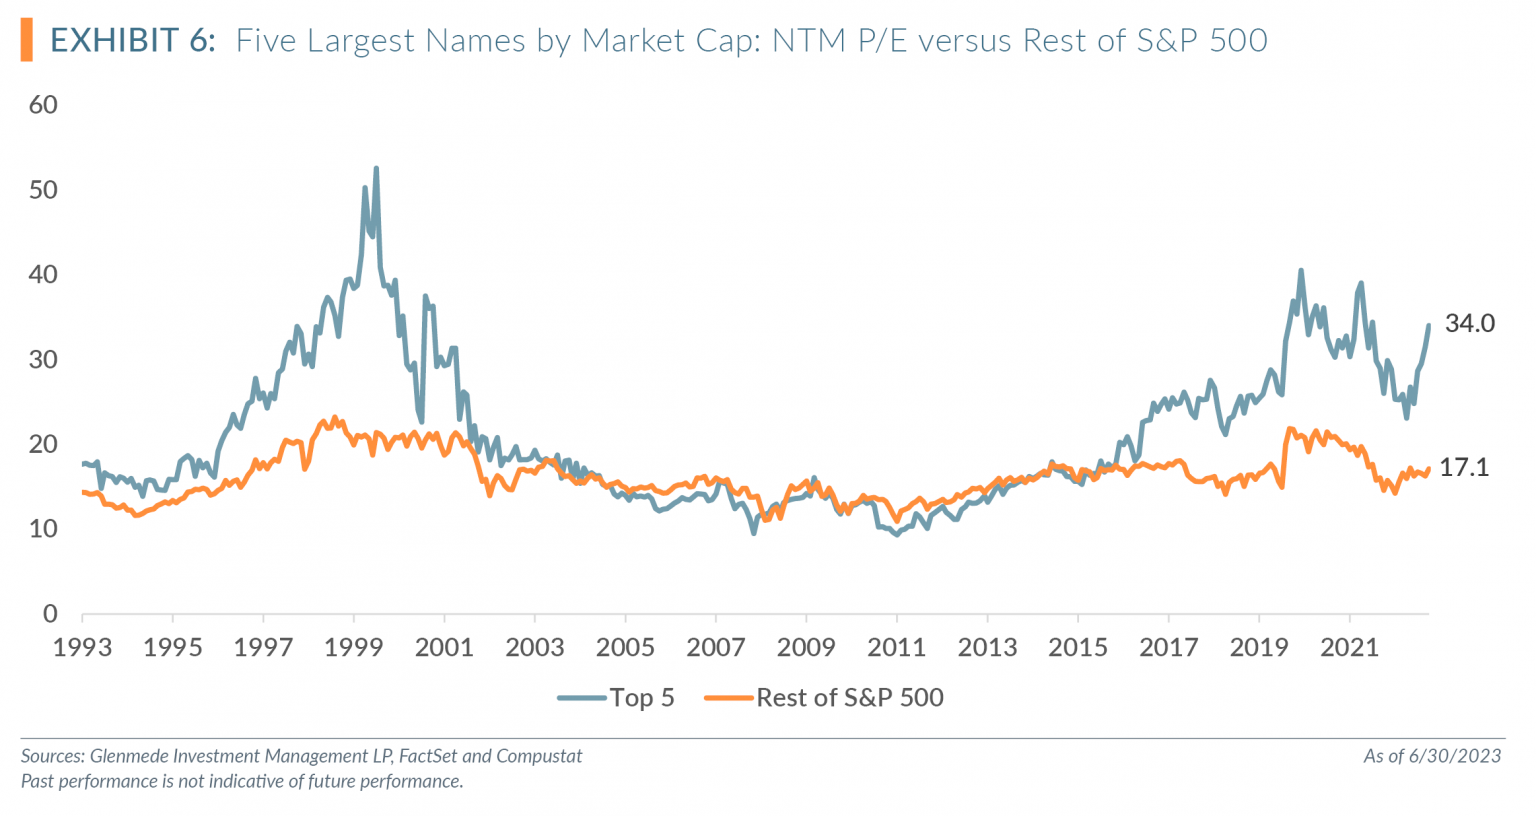
For strategies in which valuation is a core tenet of the investment philosophy, as of quarter end the opportunity set is one of the most attractive in years. The top five component weights of the S&P 500 are currently trading in the 90th percentile relative to the past 30 years. Specifically, as seen in Exhibit 6, the next-12-month price/earnings (NTM P/E) of the largest five weighted stocks is 34.0x, which is almost double the median since September 1993 of 17.9x. This compares to the rest of the index trading at NTM P/E of 17.1x, which is in the 68th percentile and a median of 15.8x during this same time period.
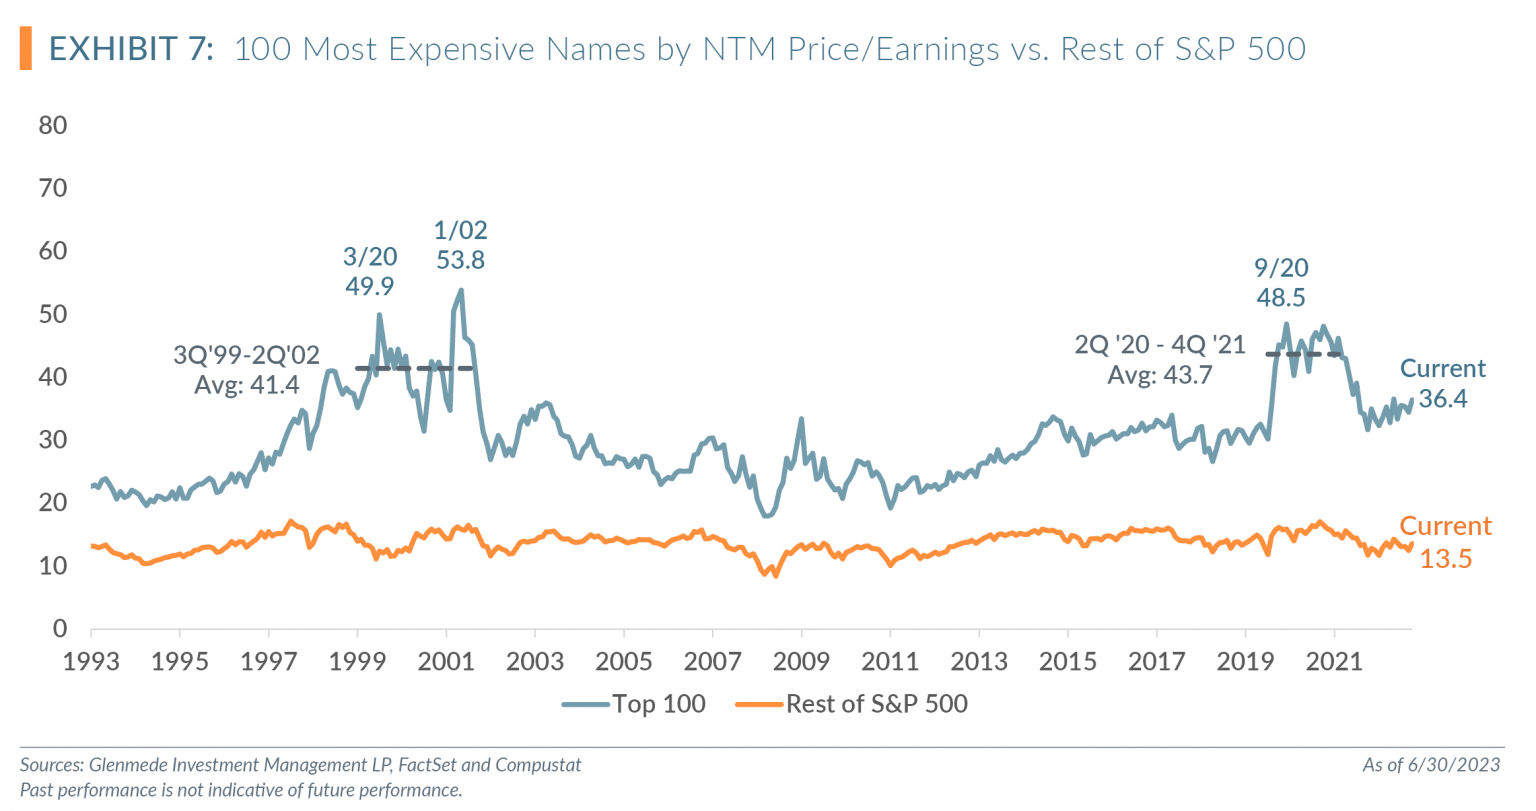
Some of the most expensive names of the S&P 500 based on NTM P/E are not in the top five market cap weighted stocks. Exhibit 7 shows a comparison of the top 100 most expensive names based on NTM P/E relative to the rest of the index. The top 100 most expensive stocks based on NTM P/E currently trade at 36.4x compared to the median since September 1993 of 29.0x, putting the current levels in the 83rd percentile over this time period. Additionally, the remaining 400 companies currently trade at 13.5x NTM P/E, in the 42nd percentile compared to the median of 13.9x during this same time period.
Our Debate
How do we position for potential outperformance as an active manager during periods of extreme concentration, since the timing of the unwinding of concentration is not predictable, albeit likely inevitable? An argument can be made that an active manager with a valuation focus can be a diversifier to the more accessible passive index strategies that are subject to potential overvaluations of specific stocks, sectors or the overall market and therefore could experience valuation corrections or crashes. We believe an active strategy can mitigate overexposure of the indices to historically expensive companies and overweight to more valuation attractive opportunities, ideally creating alpha over a market cycle. We also believe the opportunity set for relative value companies is one of the most attractive we have seen.
Thanks to the GIM Quantitative team of Val de Vassal, Alex Atanasiu, Paul Sullivan, Jake Adamcik, David Marcucci and Ruohao Chen for their extensive work on index concentration risks. For additional reading of market concentration from the GIM Quantitative team, please contact your GIM Sales representative for a copy of Concentration Traps of Equity Indexing.
Top Five Quarterly Charts
Our Quantitative investment team produces a number of tables and charts throughout the quarter. Here are what we believe are the top five most interesting ones from this quarter.
Description: A comparison of rolling 3-month periods of S&P 500 market cap weighted versus S&P 500 equal weighted performance.
Observations:
- The three months ending May 2023 experienced the largest outperformance of S&P 500 cap weighted versus equal weighted since data became available in 1990, with 10.1% outperformance compared to a 3-month end average from 1990 of equal weighted outperforming cap weighted by 30bps.
- The narrowness of market returns was at extremes, as evidence by this spread.
Description: Float-adjusted market cap value for the five mega cap stocks of the S&P 500 index in both the internet bubble and the current period of market concentration versus the net income and sales as a percent of the S&P 500 during both periods.
Observations:
- The period of the internet bubble in 2000 and the post-COVID rally of mega cap growth stocks both saw the top five weightings of the S&P 500 increase notably in market value without the same percentage of net income or sales growth.
- The reversal of the market value increase in the dot-com era was swifter than the current period of concentration that has returned after a brief reversal last year.
Description: The YTD return of the top six weighted constituents of the S&P 500 versus the total return of the index with and without these six stocks.
Observations:
- More than 60% of this year’s YTD return for the S&P 500 is explained with six stocks.
Description: Percentage of the U.S. Treasury yield curve that is inverted and U.S. recessions.
Observations:
- Historically, recessions followed when over 50% of the Treasury yield curve was inverted.
- As of Q2 2023, 78% of the yield curve was inverted.
1 Memory lane for us GenXers — https://www.nurseryrhymes.org/concentration-64.html.
2 This includes companies that have merged (e.g., Exxon Corporation becoming Exxon Mobil Corporation in 1999) or reformed (e.g., AT&T).
3 Parvarandeh, S., N. Calder, K. Beuning, and A. Pepper. “Linking Long-Term Strategy and Executive Incentives.” Innosight, August 2022. https://www.innosight.com/insight/linking-long-term-strategy-and-executive-incentives/.
All data is as of 6/30/2023 unless otherwise noted. Opinions represent those of Glenmede Investment Management LP (GIM) as of the date of this report and are for general informational purposes only. This document is intended for sophisticated, institutional investors only and is not intended to predict or guarantee the future performance of any individual security, market sector or the markets generally. GIM’s opinions may change at any time without notice to you.
Any opinions, expectations or projections expressed herein are based on information available at the time of publication and may change thereafter, and actual future developments or outcomes (including performance) may differ materially from any opinions, expectations or projections expressed herein due to various risks and uncertainties. Information obtained from third parties, including any source identified herein, is assumed to be reliable, but accuracy cannot be assured. This paper represents the view of its authors as of the date it was produced, and may change without notice. There can be no assurance that the same factors would result in the same decisions being made in the future. In addition, the views are not intended as a recommendation of any security, sector or product. Returns reported represent past performance and are not indicative of future results. Actual performance may be lower or higher than the performance set forth above.