The Quarterly Statement Q3 2023: Why Small Cap Now
Market Review Third Quarter 2023
Why Small Cap Now
What We Know: Q3 2023 Recap
Equity markets lost some of their steam in the quarter as investor sentiment turned cautious amid hawkish Federal Reserve (Fed) commentary, higher oil prices, labor strikes and concerns of a potential U.S. government shutdown. The Federal Open Market Committee hiked rates 25 bps in July and paused in September. However, investor sentiment seemed less dismissive of the Fed’s “higher for longer” rhetoric when the September dot plot median expectation for 2024 reflected only a 50 bps cut versus June’s 100 bps potential cut expectation. The U.S. Treasury curve steepened in the quarter with the 2Y yield increasing 15 bps to 5.05%, the 10Y yield up 73 bps to 4.57% and the 30Y increasing 84 bps to 4.71%. The U.S. Treasury 10Y-2Y yield spread, a much-watched recessionary indicator, tightened this quarter to -47 bps after widening to over -100 bps in the second quarter.
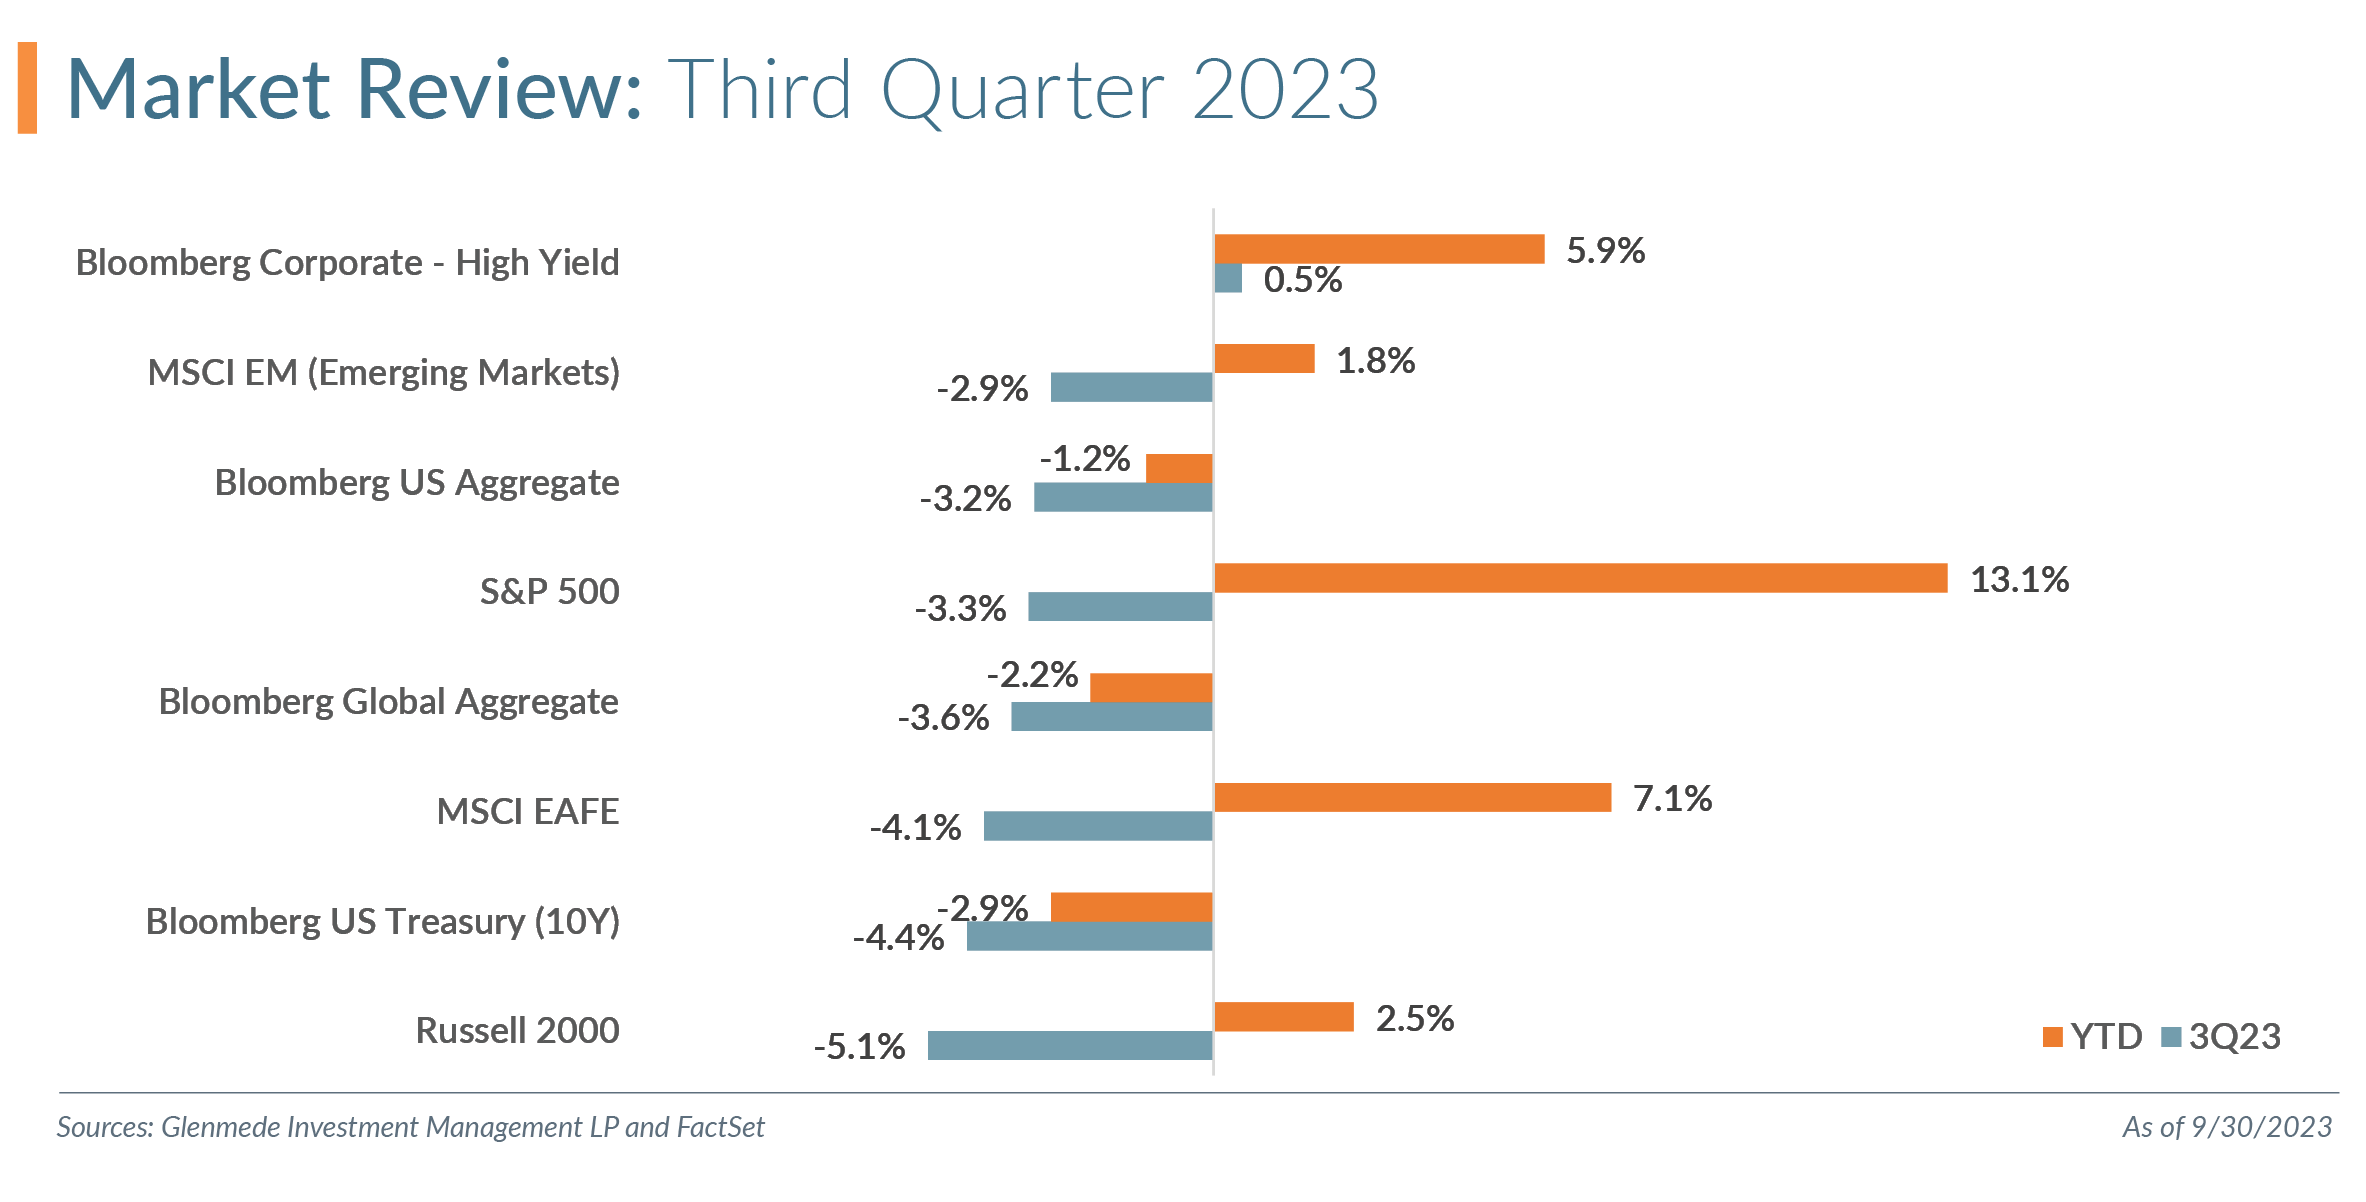
The S&P 500 had its first down quarter this year with a return of -3.3%, bringing the year-to-date (YTD) return to 13.1%. The “Magnificent Seven” (Apple, Microsoft, Alphabet, Amazon, Nvidia, Tesla and Meta) were more mixed, with Apple the underperformer at -11.6%. These seven stocks accounted for -1.0% of the index’s decline for the quarter but were the primary drivers of the YTD return (11.1% for the Magnificent Seven versus a total YTD return of 13.1%).
The Russell 1000 Value and Growth indices had roughly the same drawdowns in the quarter at -3.2% and -3.1%. Given the mega cap stock contribution to growth stocks’ performance YTD, value has experienced its second worst January to September performance relative to growth since 1979. Value trails growth YTD by 23.2% (Russell 1000 Value YTD return of 1.8% versus Russell 1000 Growth of 25.0%). The Russell 1000 Growth Index is highly concentrated, with the top five weights accounting for more than 40% of the index, more than double the longer-term average since 1979. According to the Herfindahl-Hirschman Index (HHI), a popular measure of market concentration, the Russell 1000 Growth Index has never been as concentrated, and the Russell 1000 Value Index has never been as diversified. (We discussed the HHI in our Market Snapshot published September 14, 2023.)
The Energy sector was the top S&P 500 performer in the quarter, pushed higher by rising oil prices. The sector returned 12.2%, bringing it into positive territory for the year. Both Utilities (-9.3%) and REITs (-8.9%) were underperformers for the quarter amid rising rates. While Information Technology saw a 5.6% drawdown in the quarter, the sector has experienced an impressive YTD return of 34.7%. The Communication Services sector tops YTD returns with 40.4% following a 3.1% rally in the quarter.
Small cap (Russell 2000 Index) once again underperformed large cap (S&P 500), with a drawdown of 5.1%. YTD, small cap is a notable underperformer relative to large cap (Russell 2000 YTD return of 2.5% versus S&P 500 of 13.1%). Small cap value (Russell 2000 Value Index) outperformed its growth counterpart (Russell 2000 Growth Index) in Q3 2023, -3.0% versus -7.3%, but is still behind YTD (Russell 2000 Value Index -0.6% versus Russell 2000 Growth Index 5.2%).
International markets were mixed relative to domestic markets this quarter. Developed international (MSCI EAFE Index) declined 4.1%, and international emerging markets (MSCI Emerging Markets Index) were down 2.9%. Both remain in positive territory YTD, with the MSCI EAFE Index returning 7.1% and MSCI Emerging Markets Index, 1.8%.
A Practitioner’s Perspective – Why Small Cap Now
“Whenever you find yourself on the side of the majority, it’s time to pause and reflect” — Mark Twain
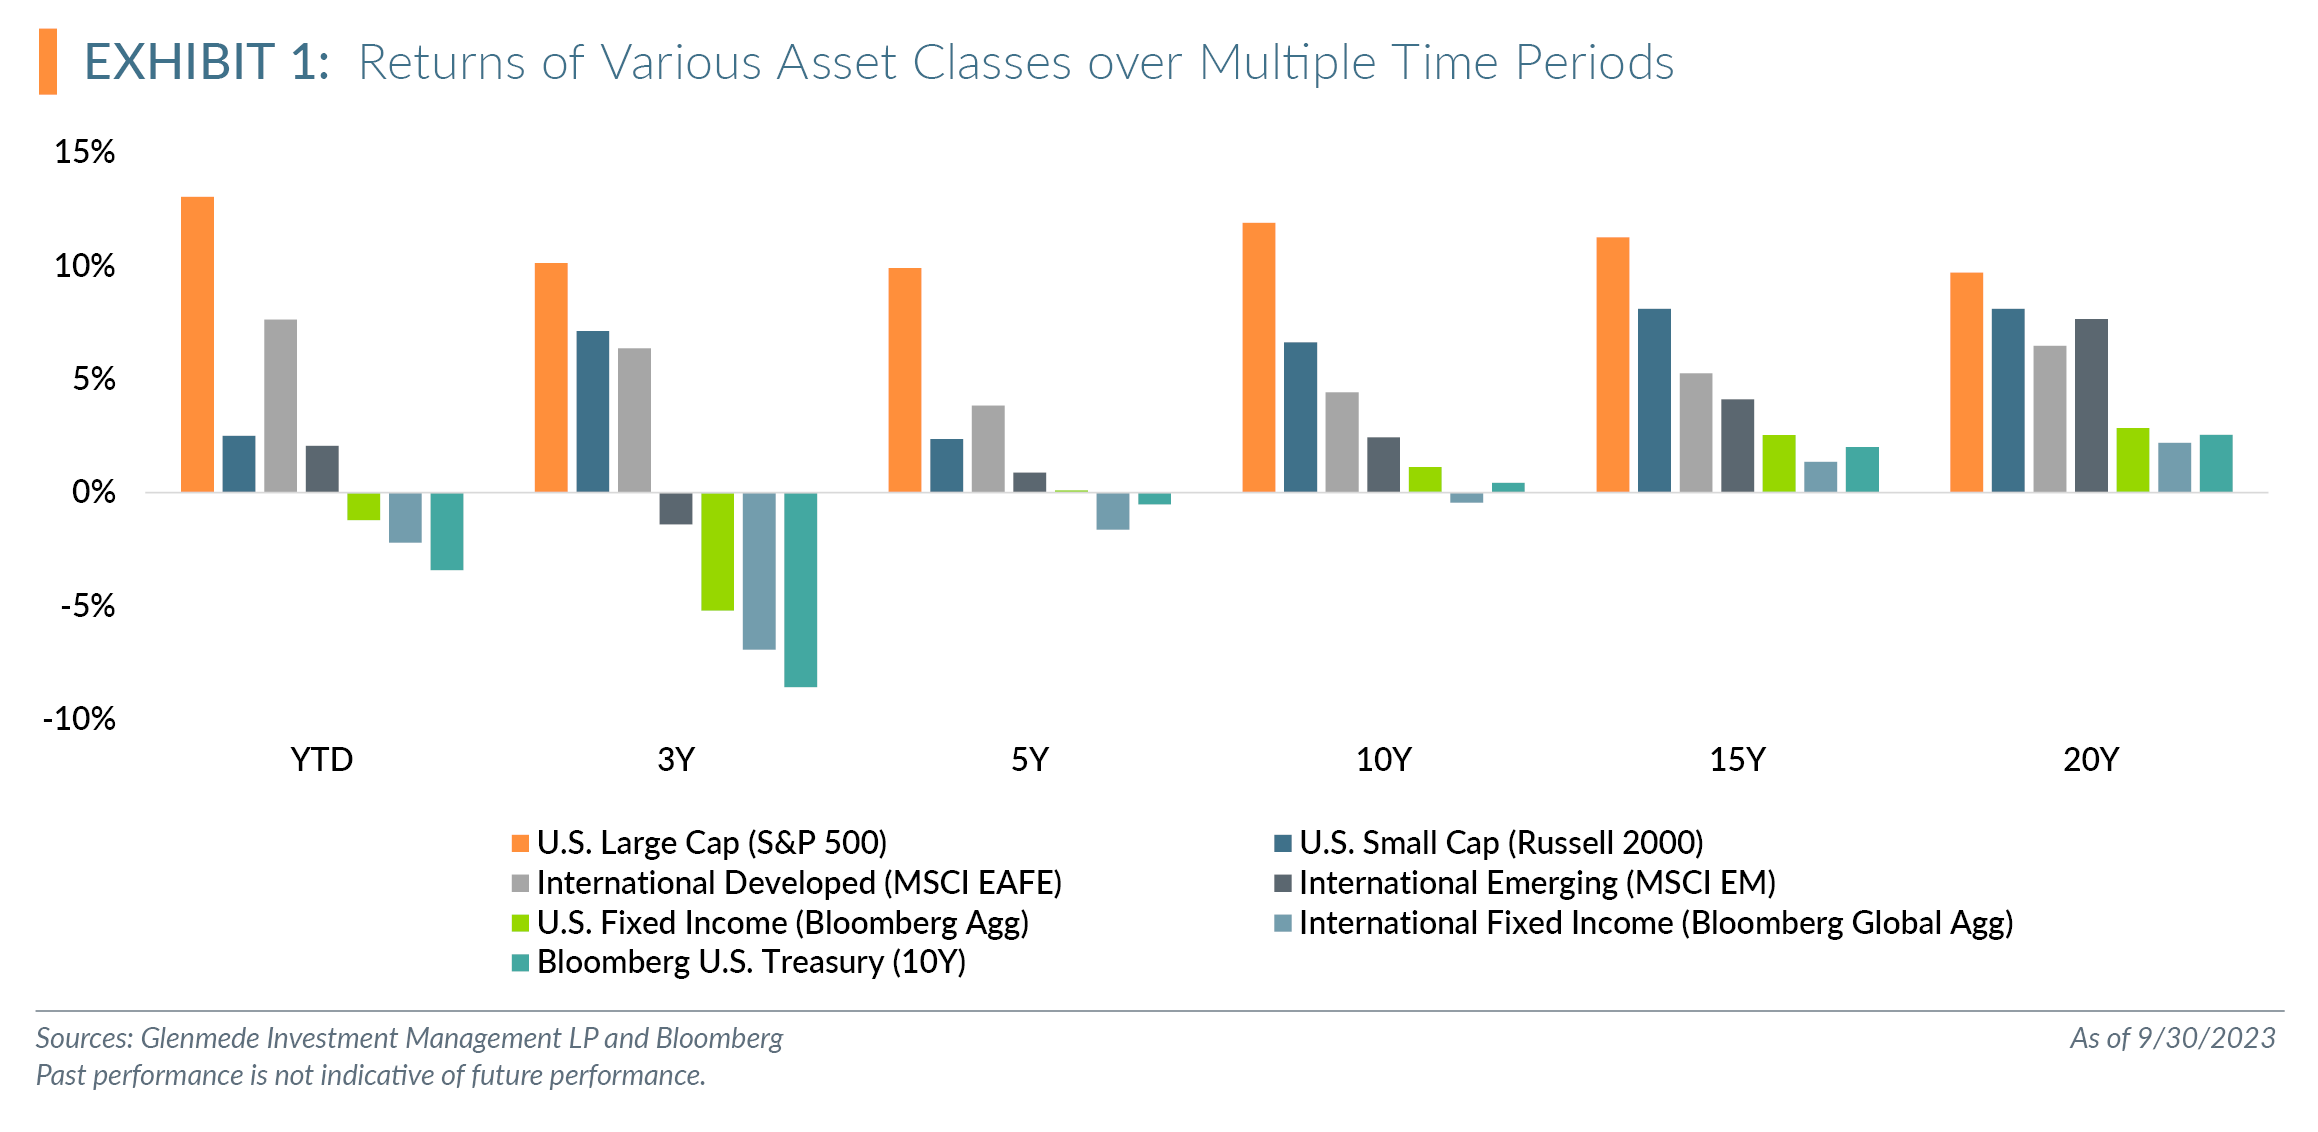
Over the past few years, U.S. large cap has been the notable outperformer relative to most other asset classes, particularly those with accessible passive strategies, as shown in Exhibit 1. Should investors stay with their U.S. large cap allocations or diversify some of that exposure? While past performance is not a guarantee of future returns, we also know that we cannot predict the future. We do, however, believe that the starting point of valuation matters to the expectancy of future returns. While there may be several investment opportunities for investors debating reducing their long U.S. large cap exposure, we argue that U.S. small cap exposure has earned its way into those discussions.
Timing
With much debate about a looming U.S. recession, why catch the “falling knife” of small cap? To better define the falling knife reference, we discuss the historical performance of small cap relative to large cap around the past six recessions.
The performance of small cap relative to large cap prior to a recession has some variance. Exhibit 2 shows the performance of the S&P 500 relative to the Russell 2000 for the 12 months prior to the official start of a recession, per the National Bureau of Economic Research (NBER).
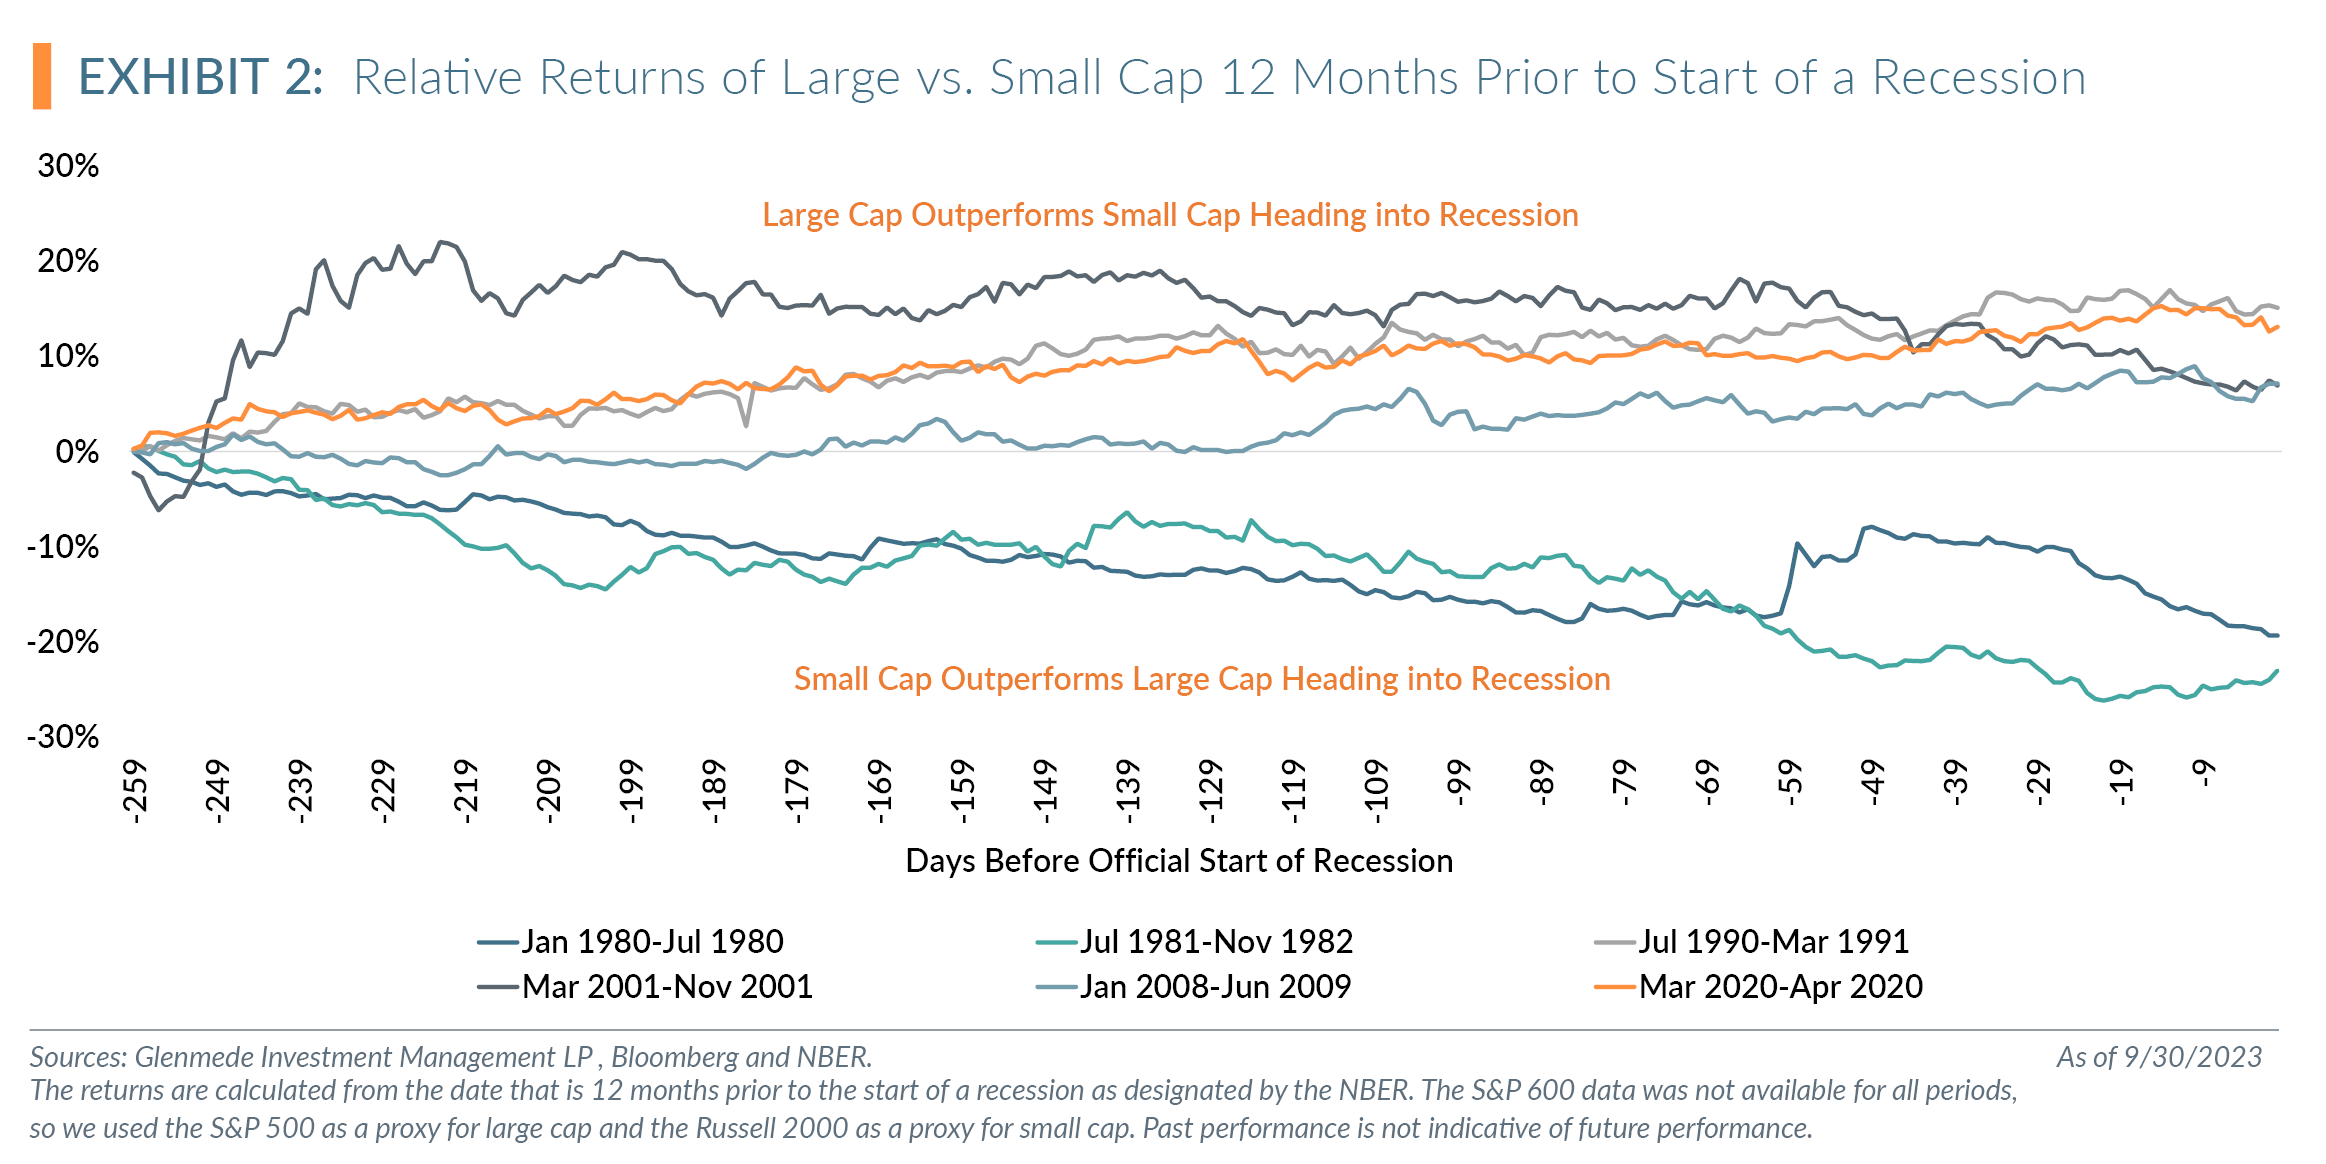
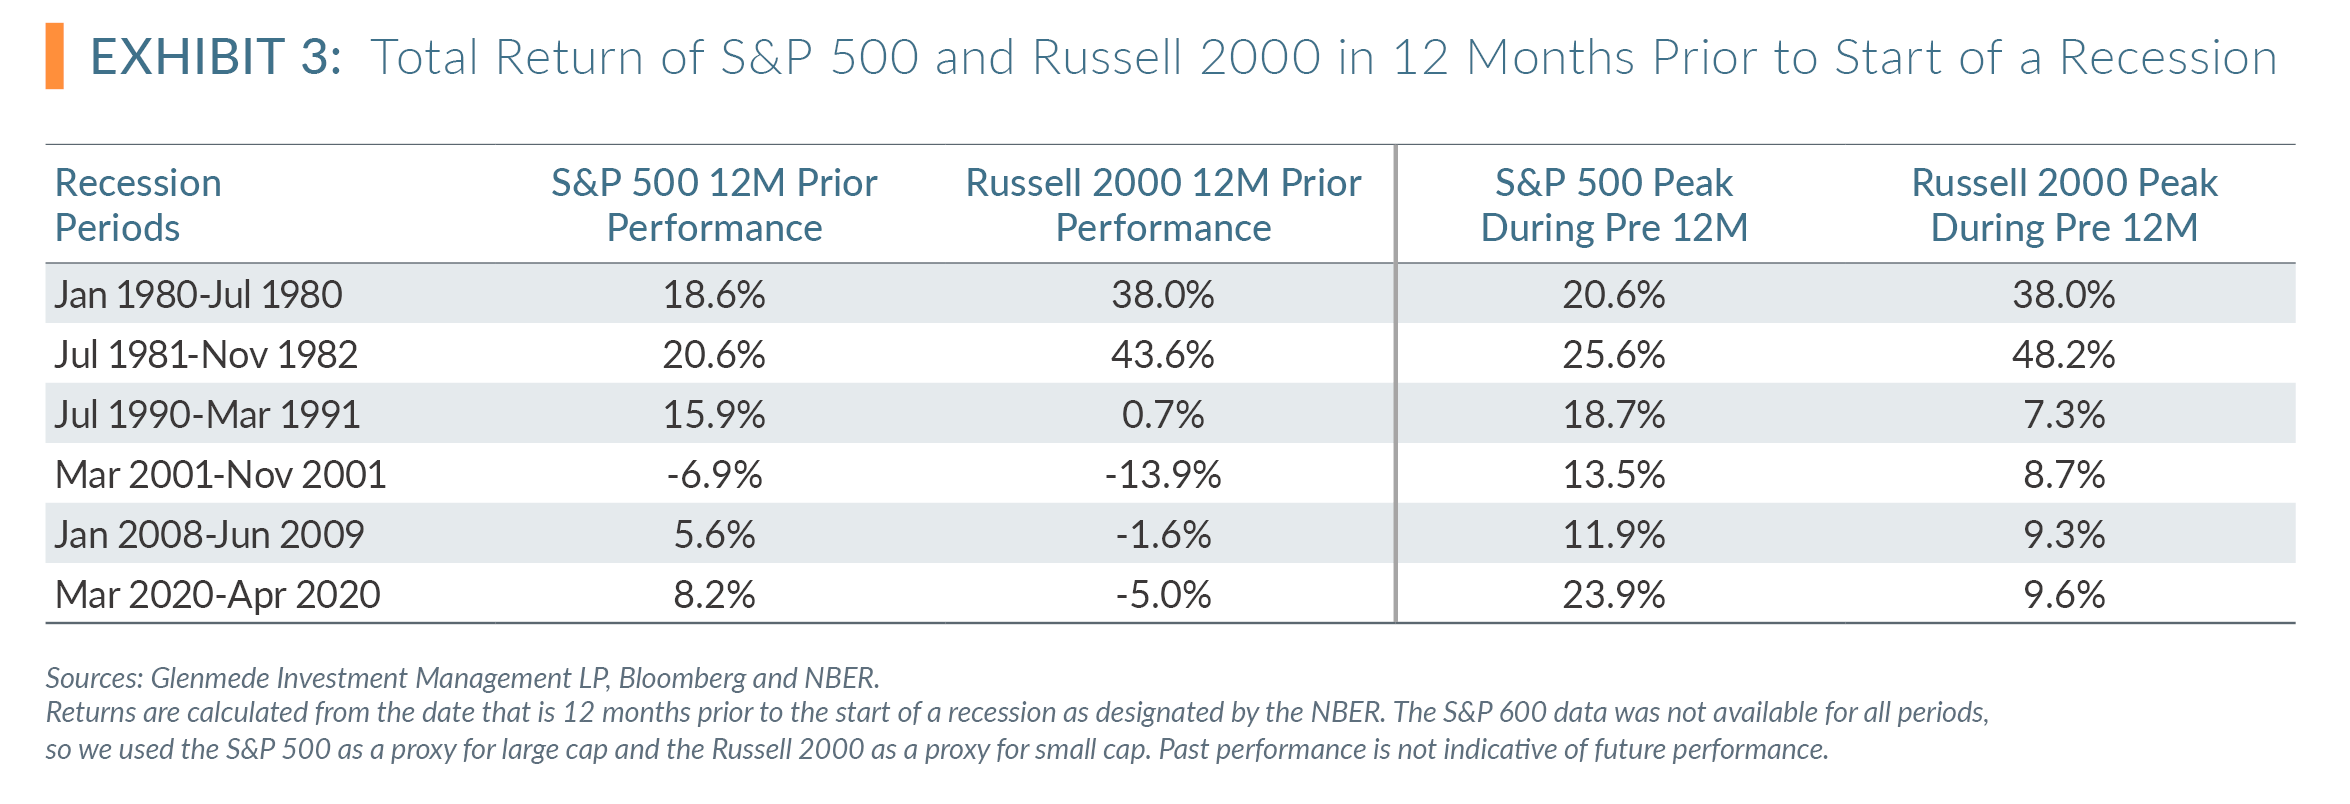
The more recent recessions saw large cap outperform small cap into the start of a recession, with small caps outperforming in the two closely recorded recessions in the 1980s. Of the six recession periods shown in Exhibit 3, the 12 months prior to a recession were not always negative returns, although most did not finish at the peaks.
During a recession, large cap stocks generally outperform small caps, although the recession around the dot-com bubble burst saw small cap slightly outperform large cap. Exhibit 4 shows the performance of large cap relative to small cap from the start to the end of each recession, as defined by the NBER. Exhibit 5 shows the return of the S&P 500 and Russell 2000 during each respective recessionary period. Overall, the performance of small cap during the defined recessions is more representative of the falling knife. The median drawdown during the past six recessions from the start is 28.3% for small cap versus 19.2% for large cap.
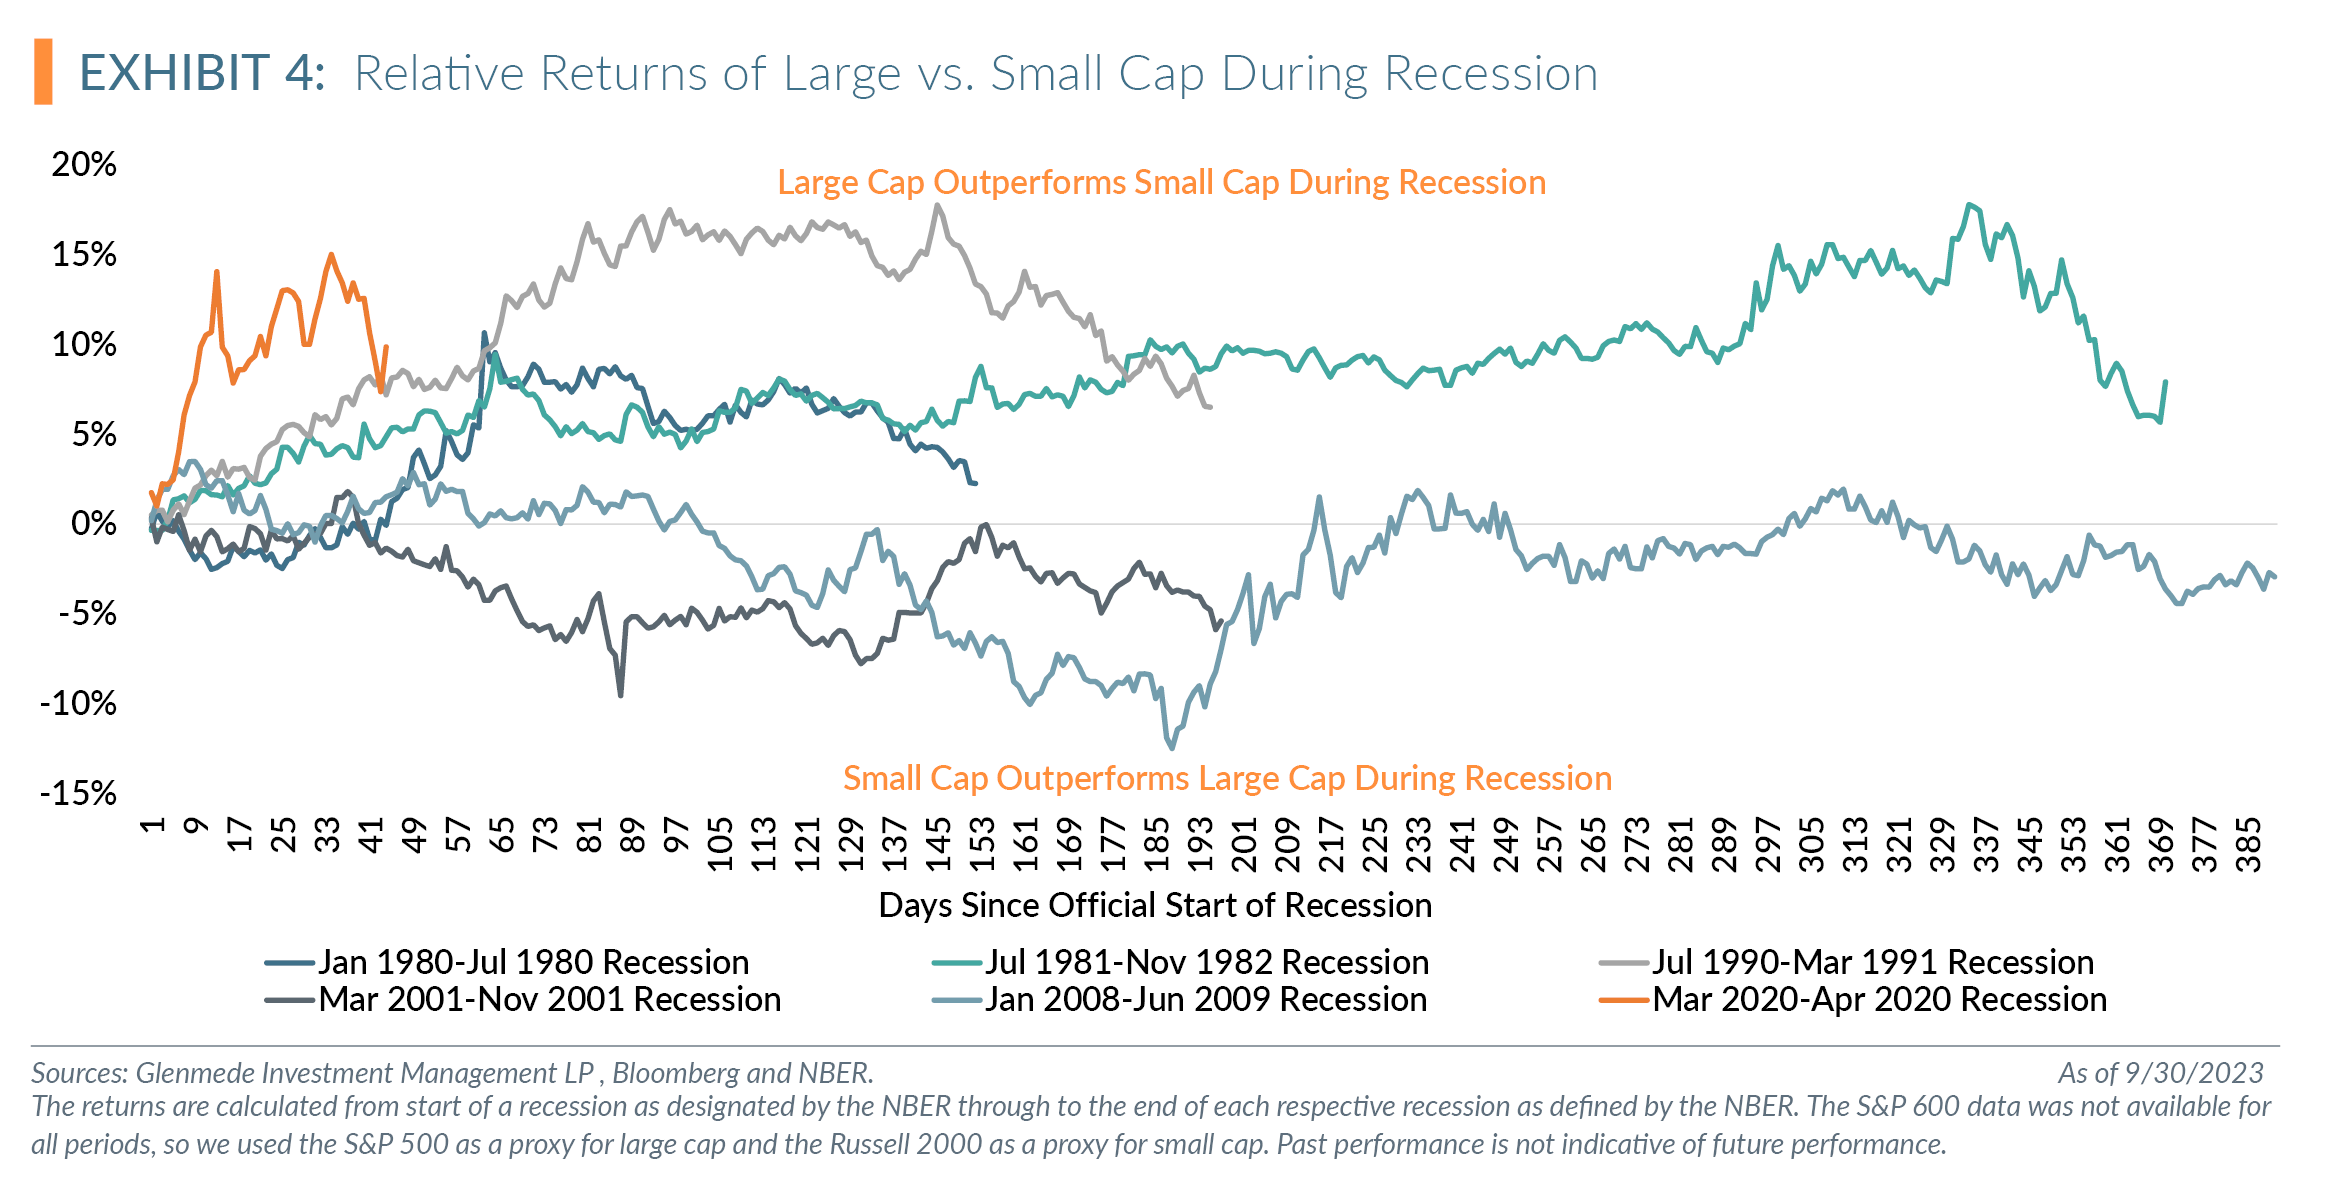
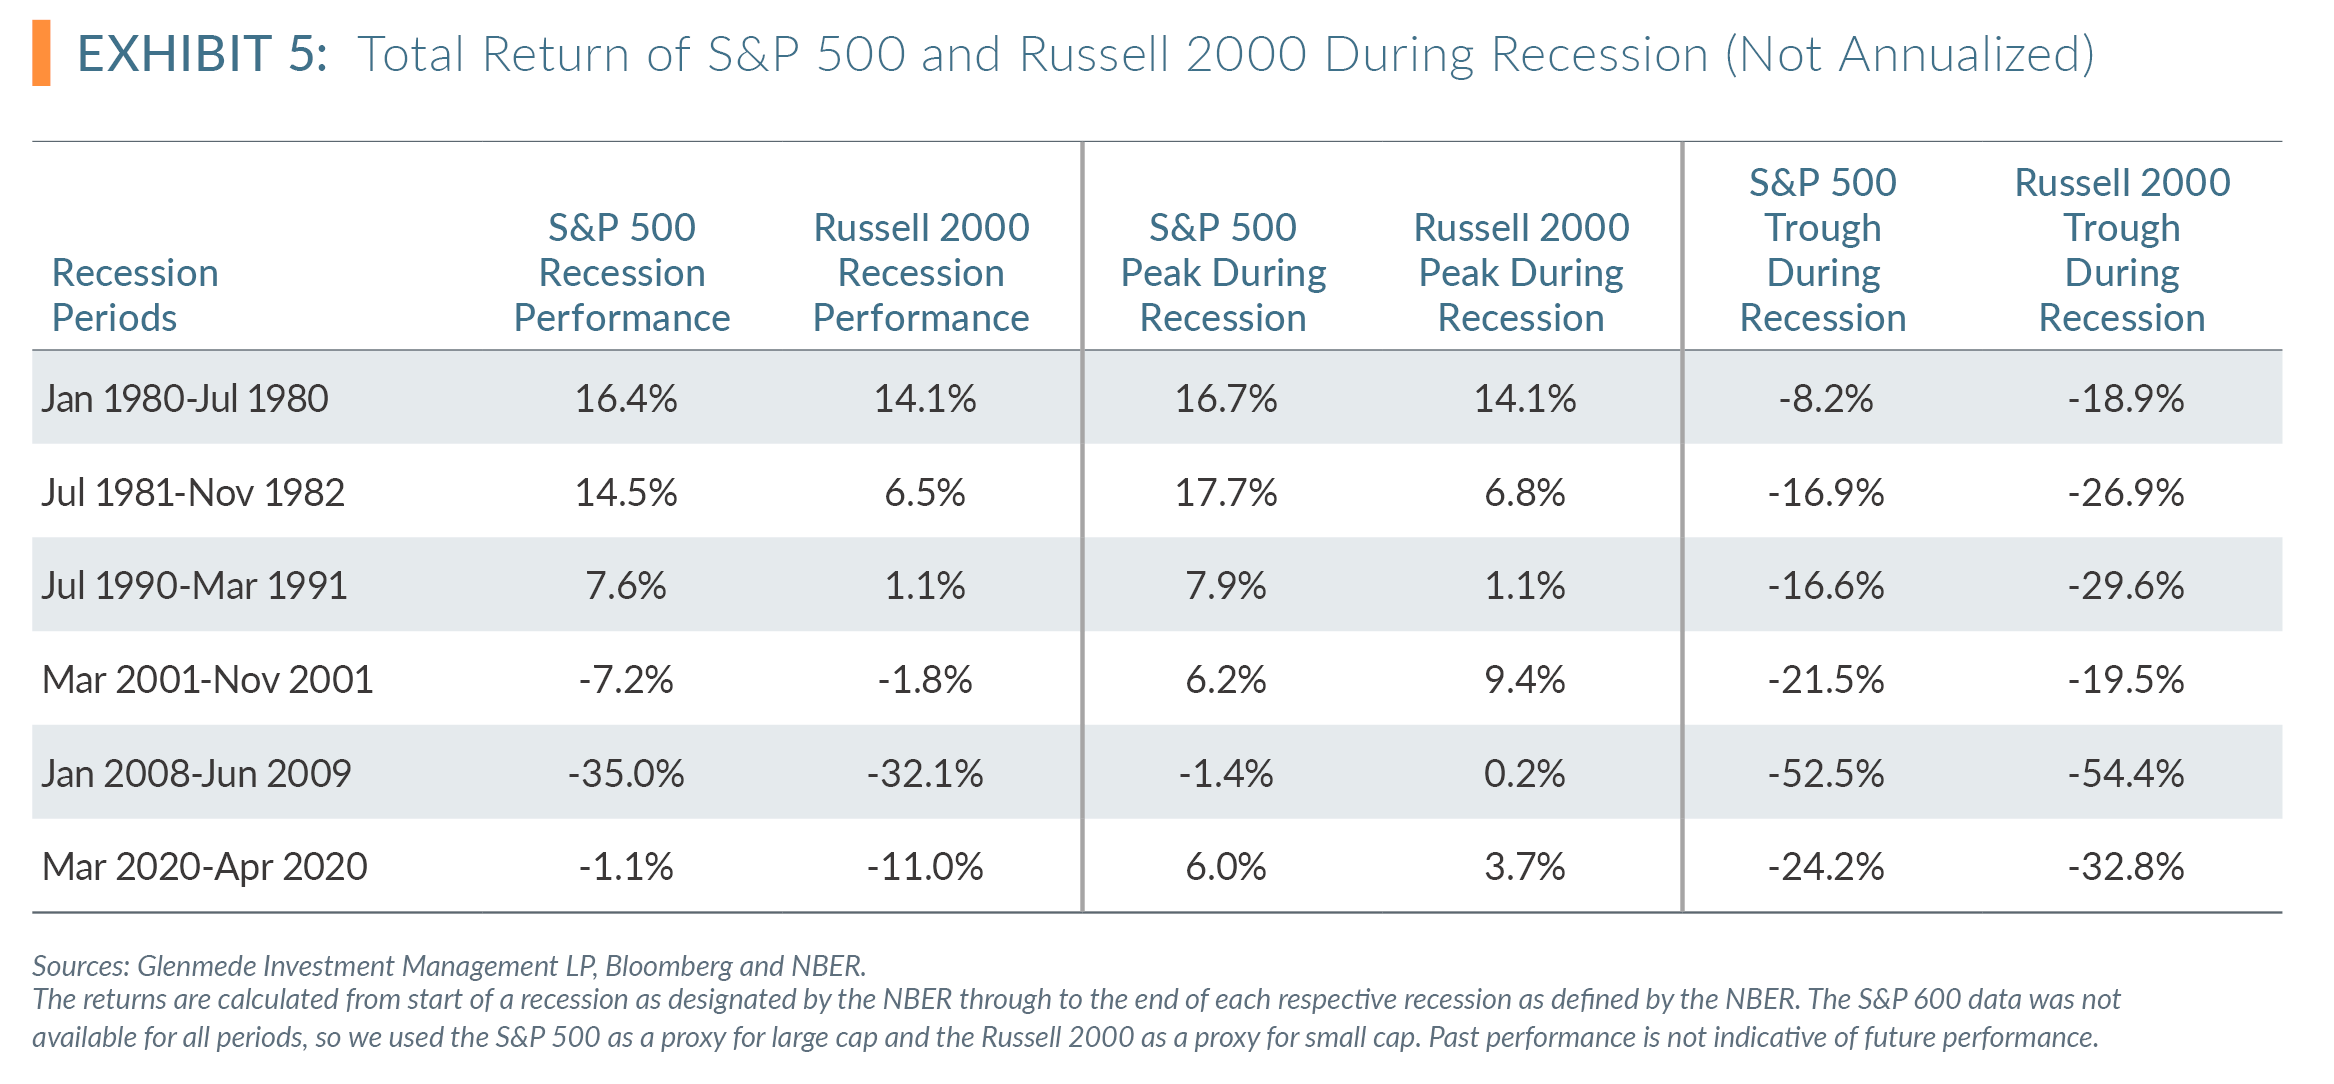
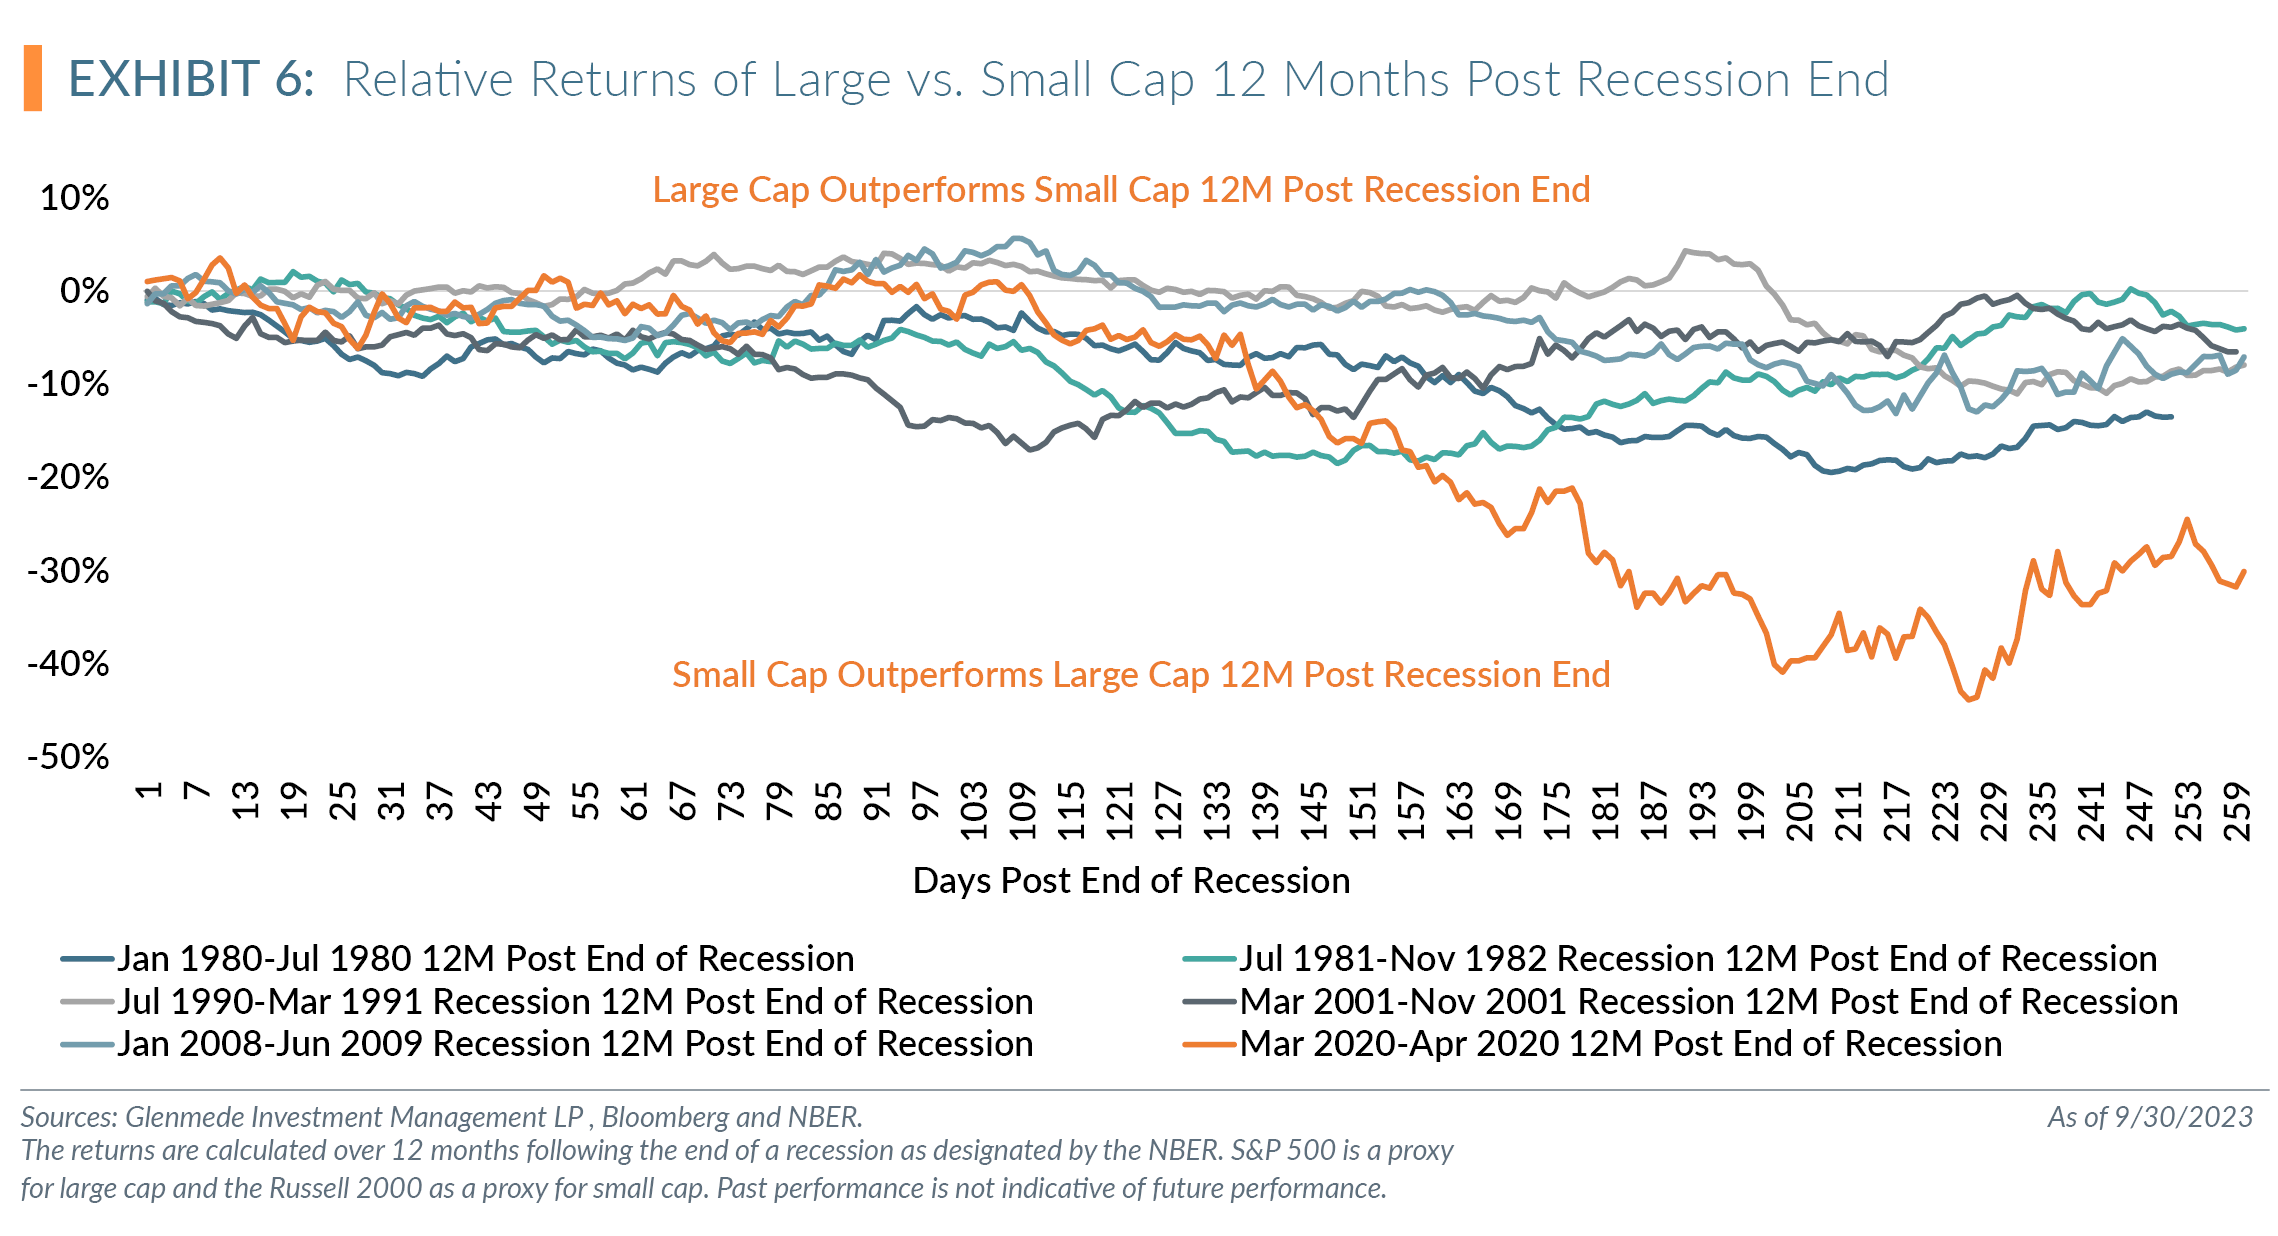
Exhibit 6 shows the performance of large cap (S&P 500) relative to small cap (Russell 2000) for the 12 months following the end of each recession. Exhibit 7 shows the total return of the S&P 500 and Russell 2000 during the 12-month period after the end of the recession. Unlike the recessionary period, the 12-month post-recession period has experienced significantly stronger returns for small cap. The median peak rally during the 12 months after the past six recessions ended is 38.9% for small cap versus 23.4% for large cap.
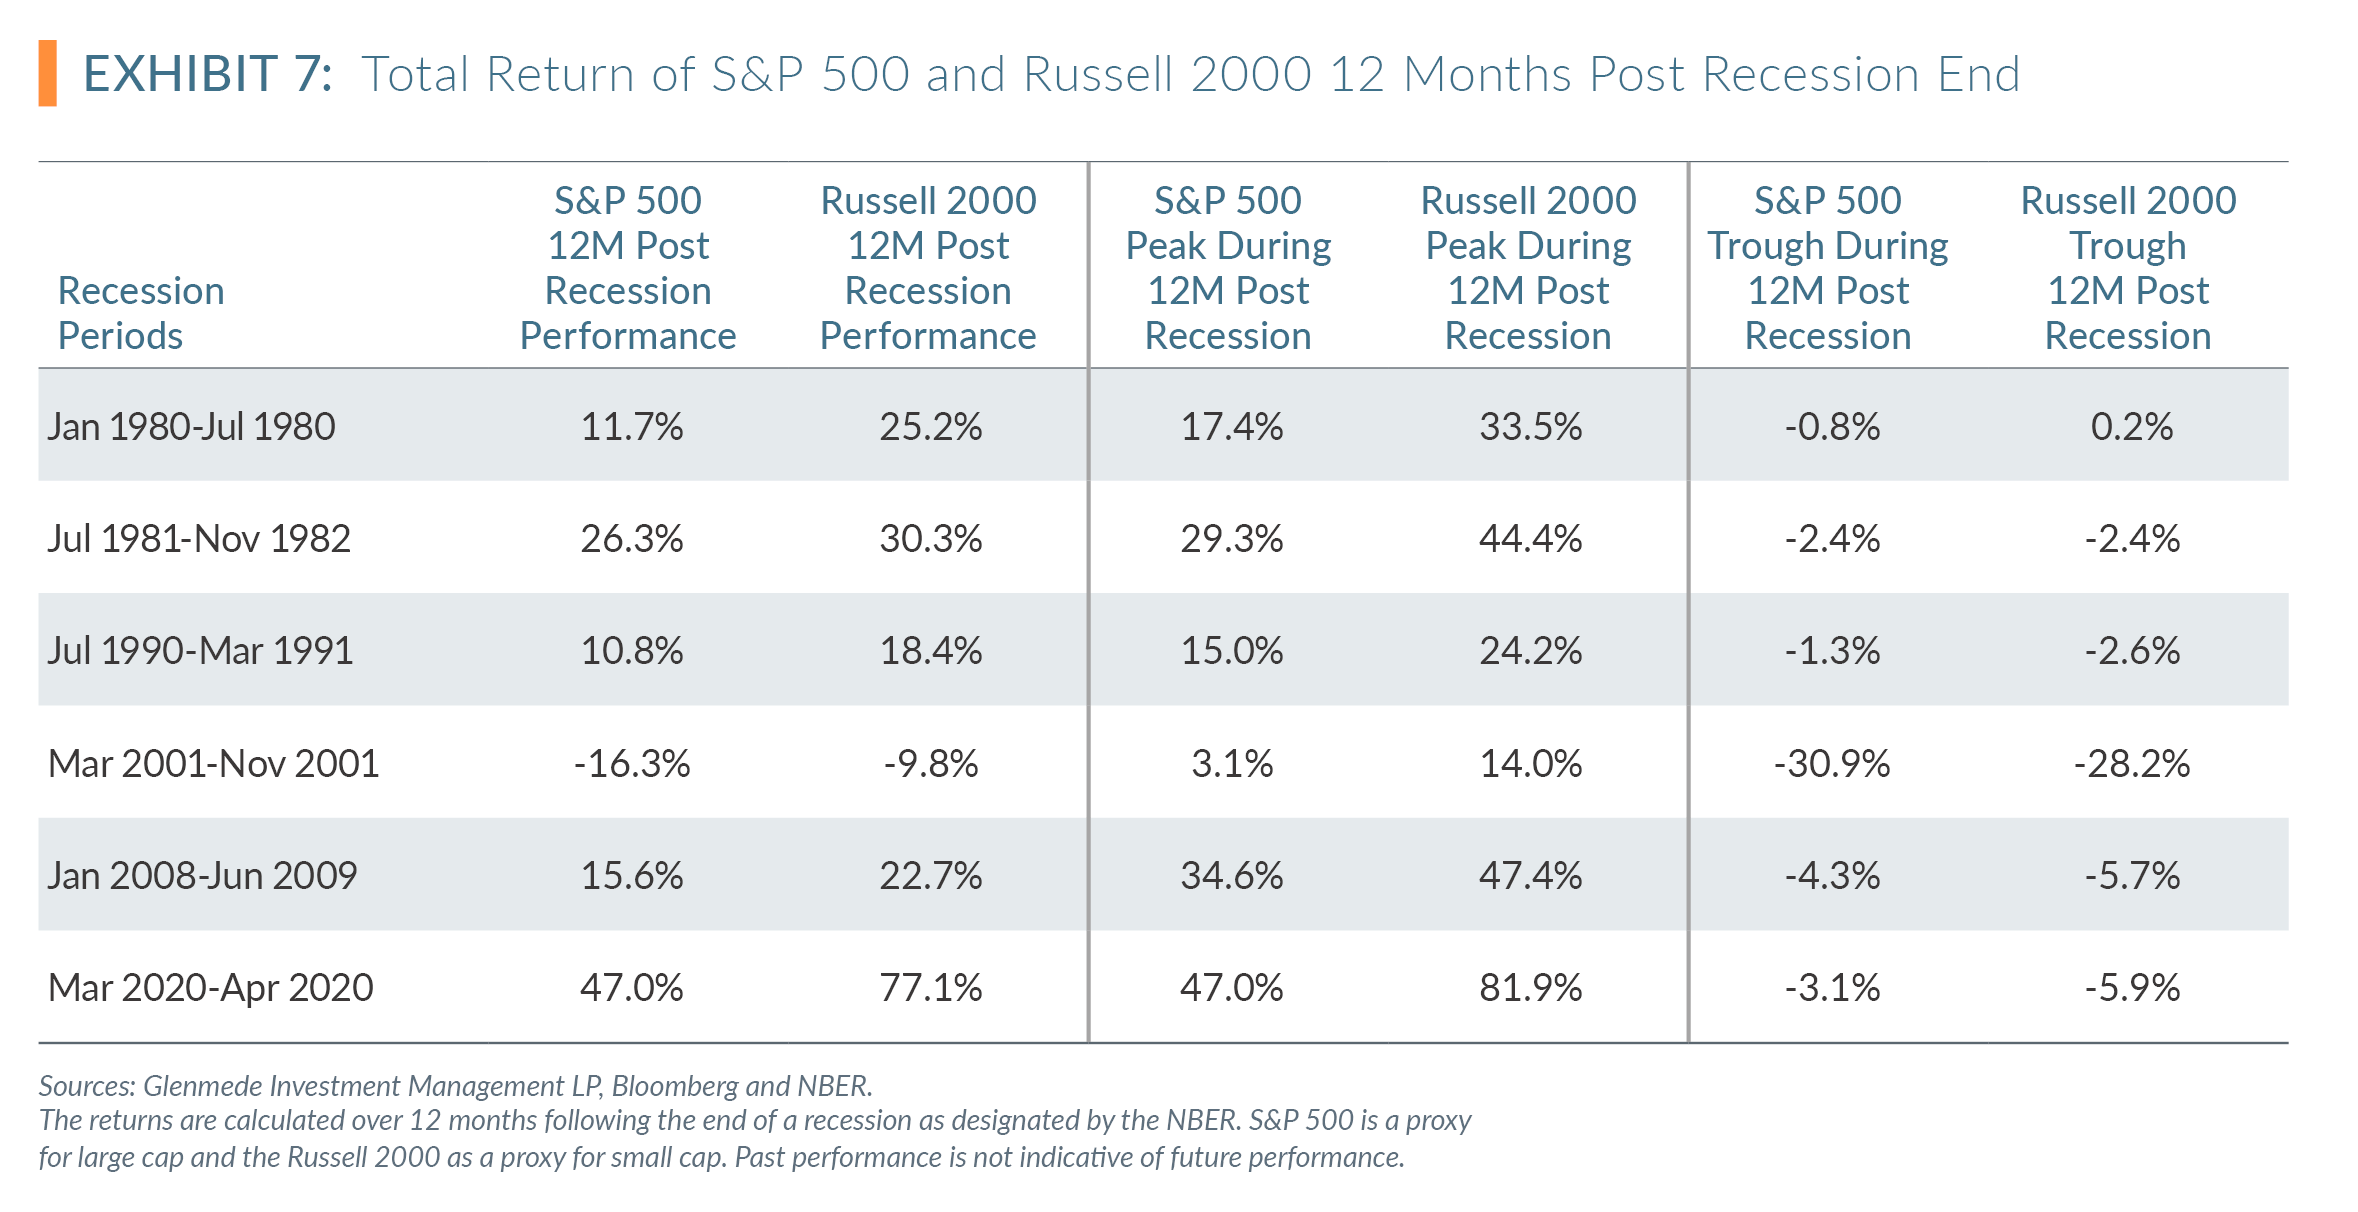
A reasonable conclusion might be to wait until a drawdown after the recession starts and consider adding small cap exposure. Alternatively, small cap stocks bought on the official start of each recession and held for 12 months after the recession officially ended still outperformed large cap by an annualized average of 4.2% for those periods, albeit with some volatile periods (S&P 500 annualized average return 9.6% versus Russell 2000 13.8%).
The flaw with trying to time the start of a recession as defined by the NBER is that the average time from when a recession started but before the NBER officially declared the start of the recession was 234 days, as noted by Newsweek.1 The recessions in the early 1990s, post dot-com and the COVID pandemic are good examples: When the NBER declared the recession, it was actually in a period that they would later claim the recession had already ended.
Some further thoughts about historical recessions. First, what if the recession does not materialize? Waiting for a recession in 2023 has a feeling of Waiting for Godot. Second, what about the current performance of the two? The S&P 500 was within 4% of its all-time price high2 in the third quarter, finishing 10.6% from those highs. The Russell 2000 is still in bear market territory from its recent all-time high on November 8, 2021. As of Q3 2023, the Russell 2000 is 26.9% from the all-time price high (24.9% when including dividends). Instead of trying to time a recession and the potential near-term bottom in small caps, we make a case for why valuation is a reasonable argument to consider small caps now.
Valuation
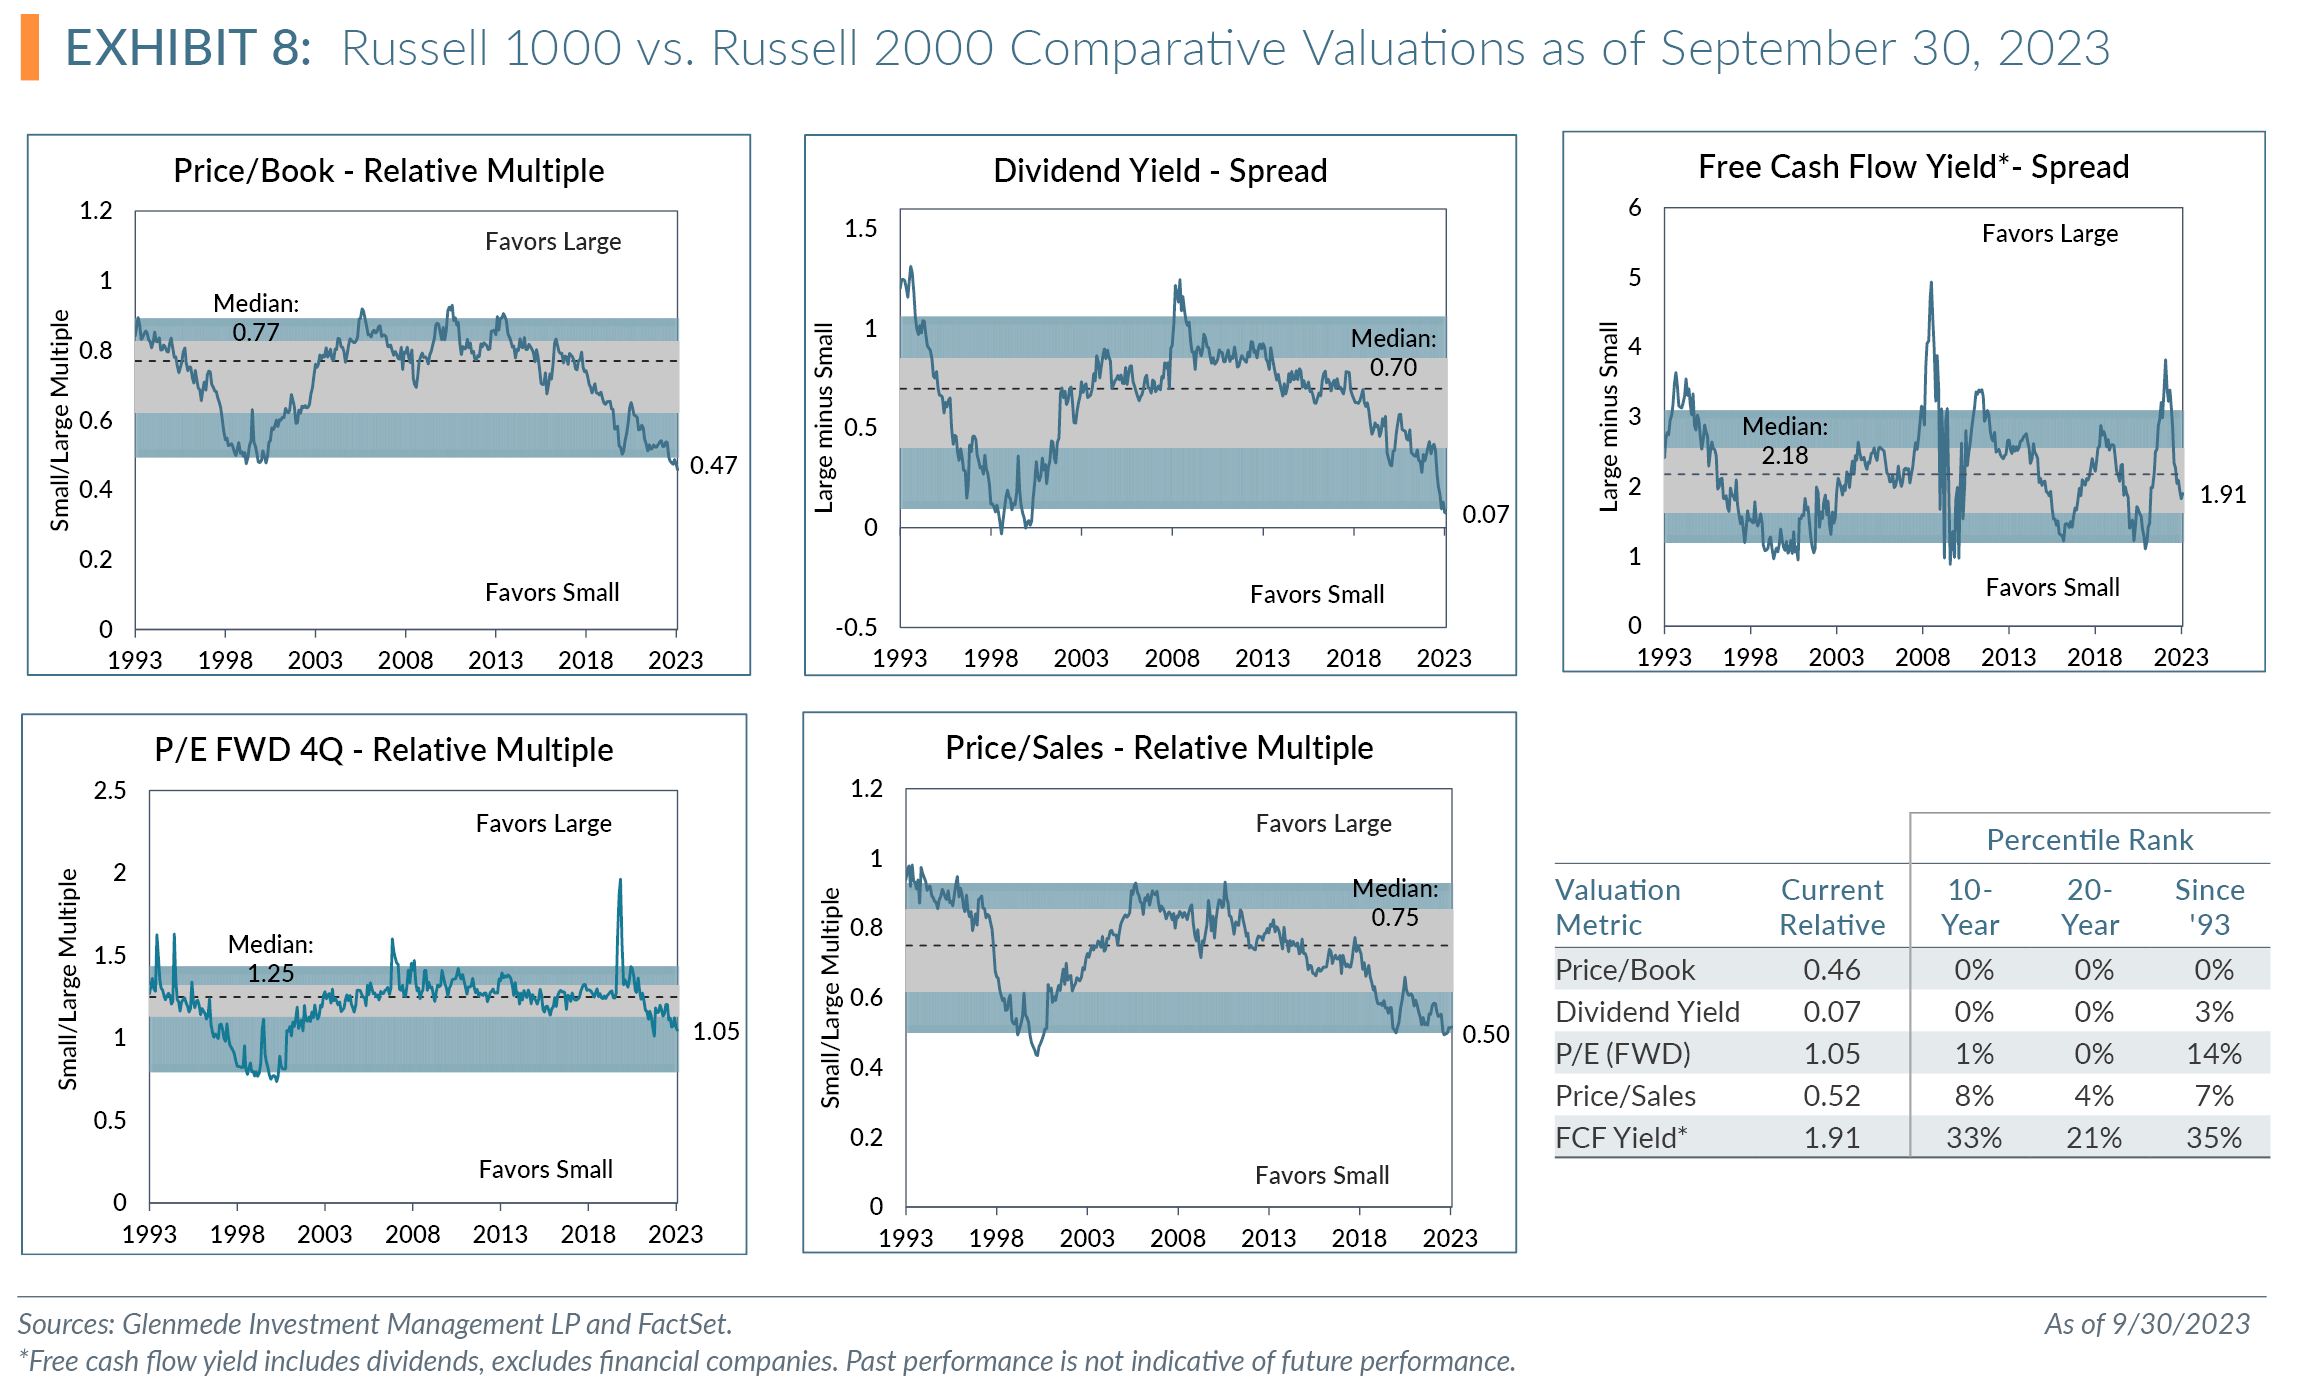
Exhibit 8 shows the comparative valuations of large cap (Russell 1000) versus small cap (Russell 2000) since 1993, with data as of quarter end. From a valuation standpoint, small cap is at one of its most attractive discounts to large cap during these past 20 years. As of quarter end, price-to-book and dividend yield are trading at the lowest valuations of large to small cap in 20 years, with forward price-to-earnings (P/E) multiples at the second lowest observations during this time period. Price-to-sales is the 11th lowest observations, in the 4th percentile over the past 20 years. At the 21st percentile, free cash flow yield spread is the one outlier not ranked at or near 20-year lows.
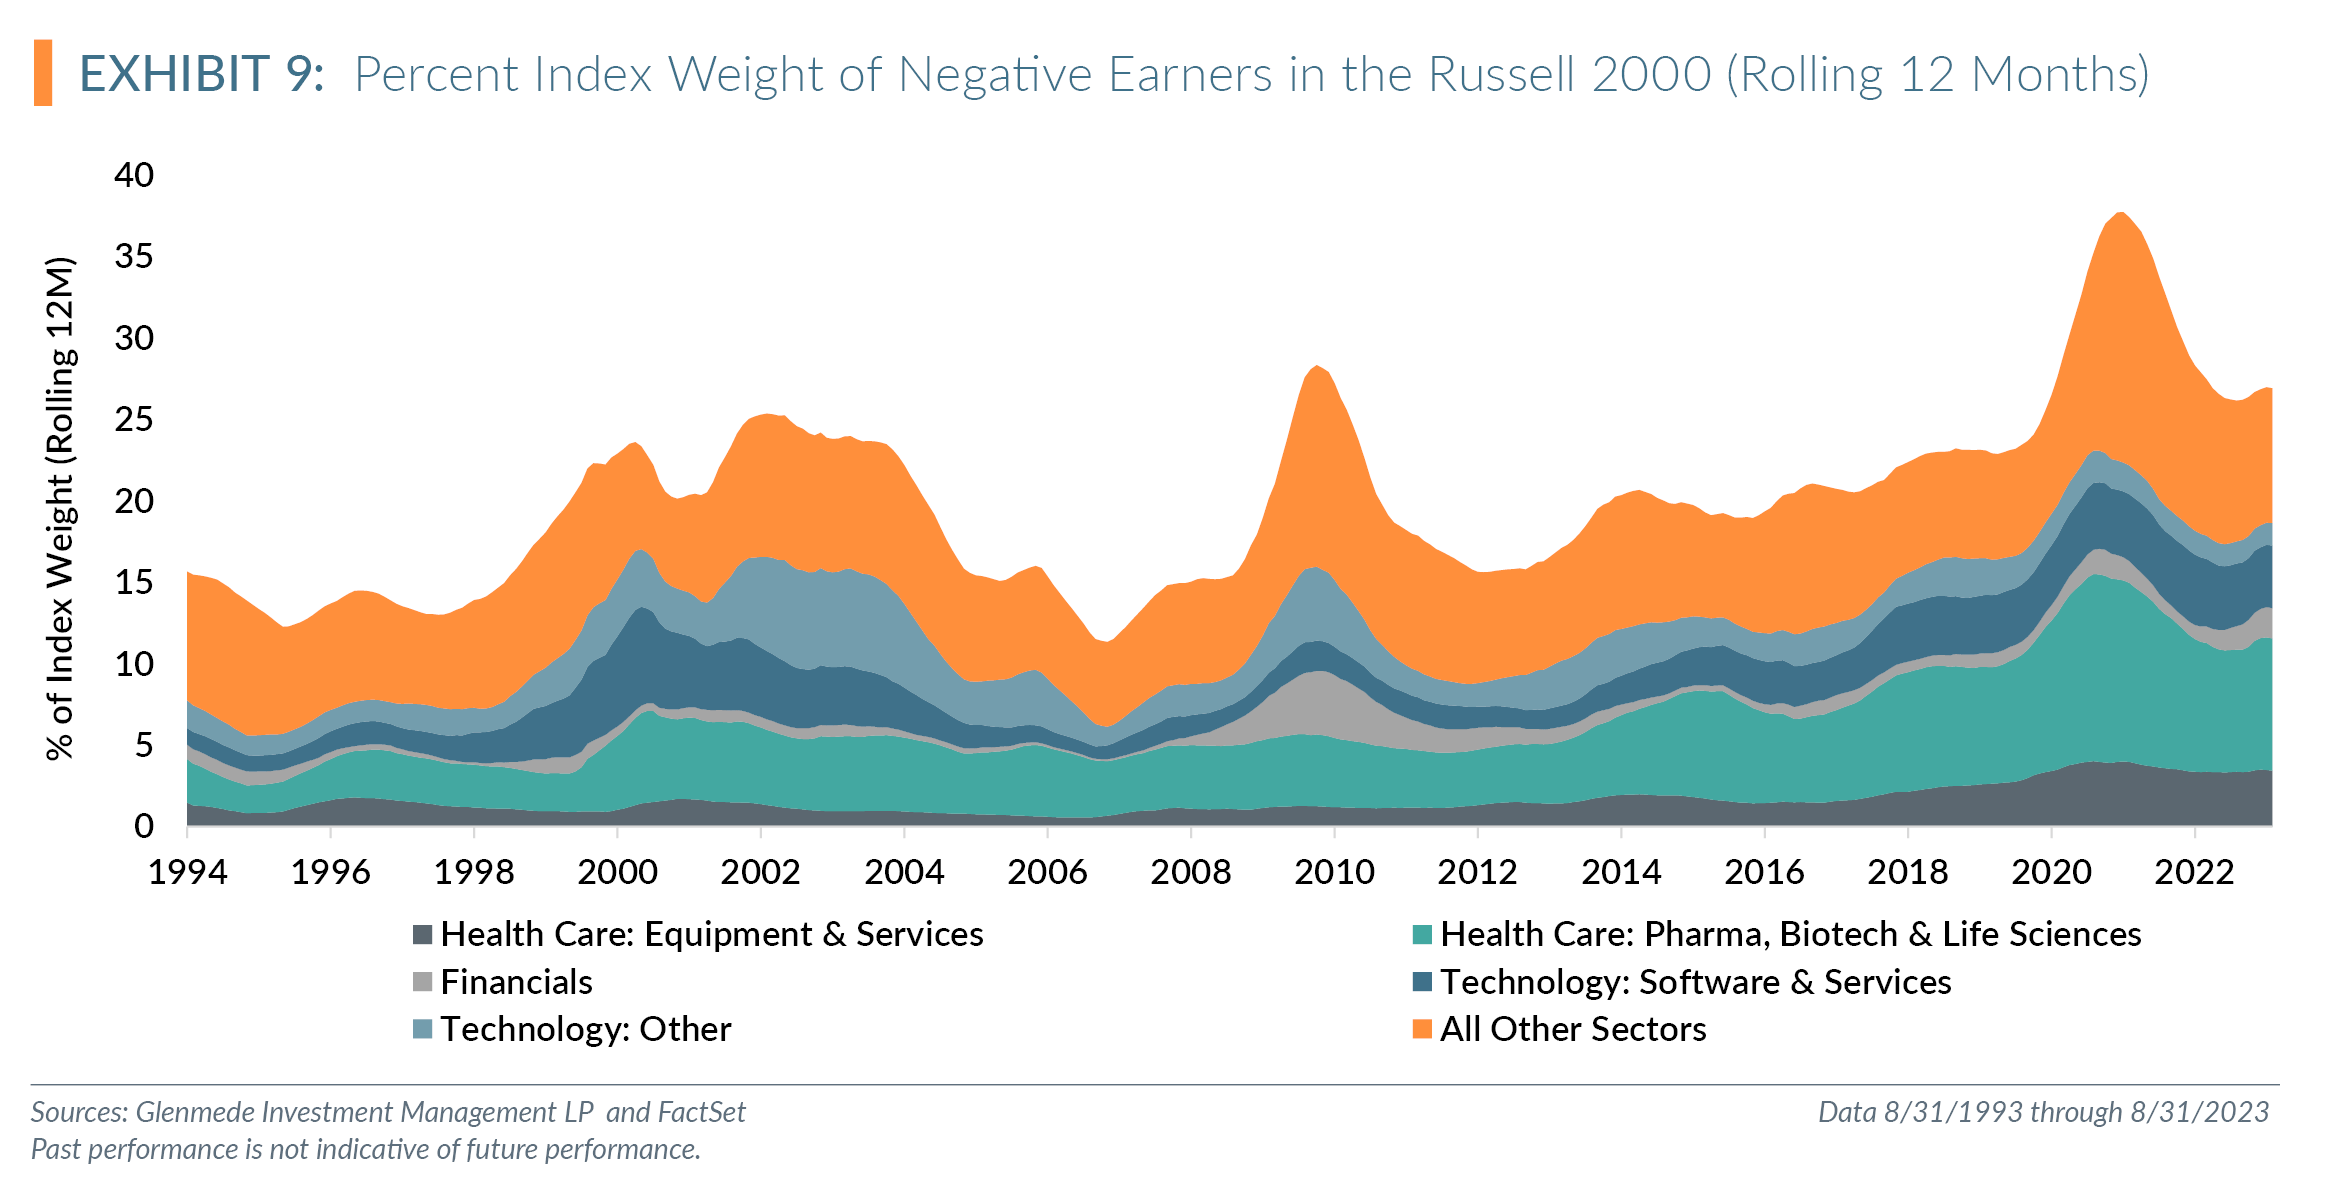
As we discuss comparative valuations over time, we should mention the negative earners component in the Russell 2000. Exhibit 9 charts the 12-month rolling weight percentage of negative earners3 in the Russell 2000 over time. As of August 31, 2023, approximately 26.5% of the constituents were negative earners with a 12-month rolling rate of 26.9%. Both the month-end and 12-month rolling percentage are below the month-end peak of 41.3% in January 2021 and 12-month rolling peak of 37.7% in July 2021, but still above the longer-term average since 1993 of 20.0% for both values.
We offer an alternative argument to the attractive relative valuation of small cap to large cap and to somewhat adjust for the negative earner composition of the Russell 2000 by using the S&P 600 as a small cap proxy. A study by S&P Dow Jones Indices4 showed that return differences of the Russell 2000 and S&P 600 from December 31, 1993, to July 31, 2019, were in part due to the inclusion of a profitability factor embedded in the S&P Small Cap 600. To remain consistent with various index methodologies, we compare the S&P 500 as a proxy for U.S. large cap to the S&P 600 as a proxy for U.S. small cap.
As shown in Exhibit 10, the forward P/E multiple of the S&P 500 is trading at a 43% premium to the S&P 600 compared to a -5.6% median relative valuation since 1993. This premium of 43% is in the 93rd percentile since 1993 and 98th percentile over the past 20 years.
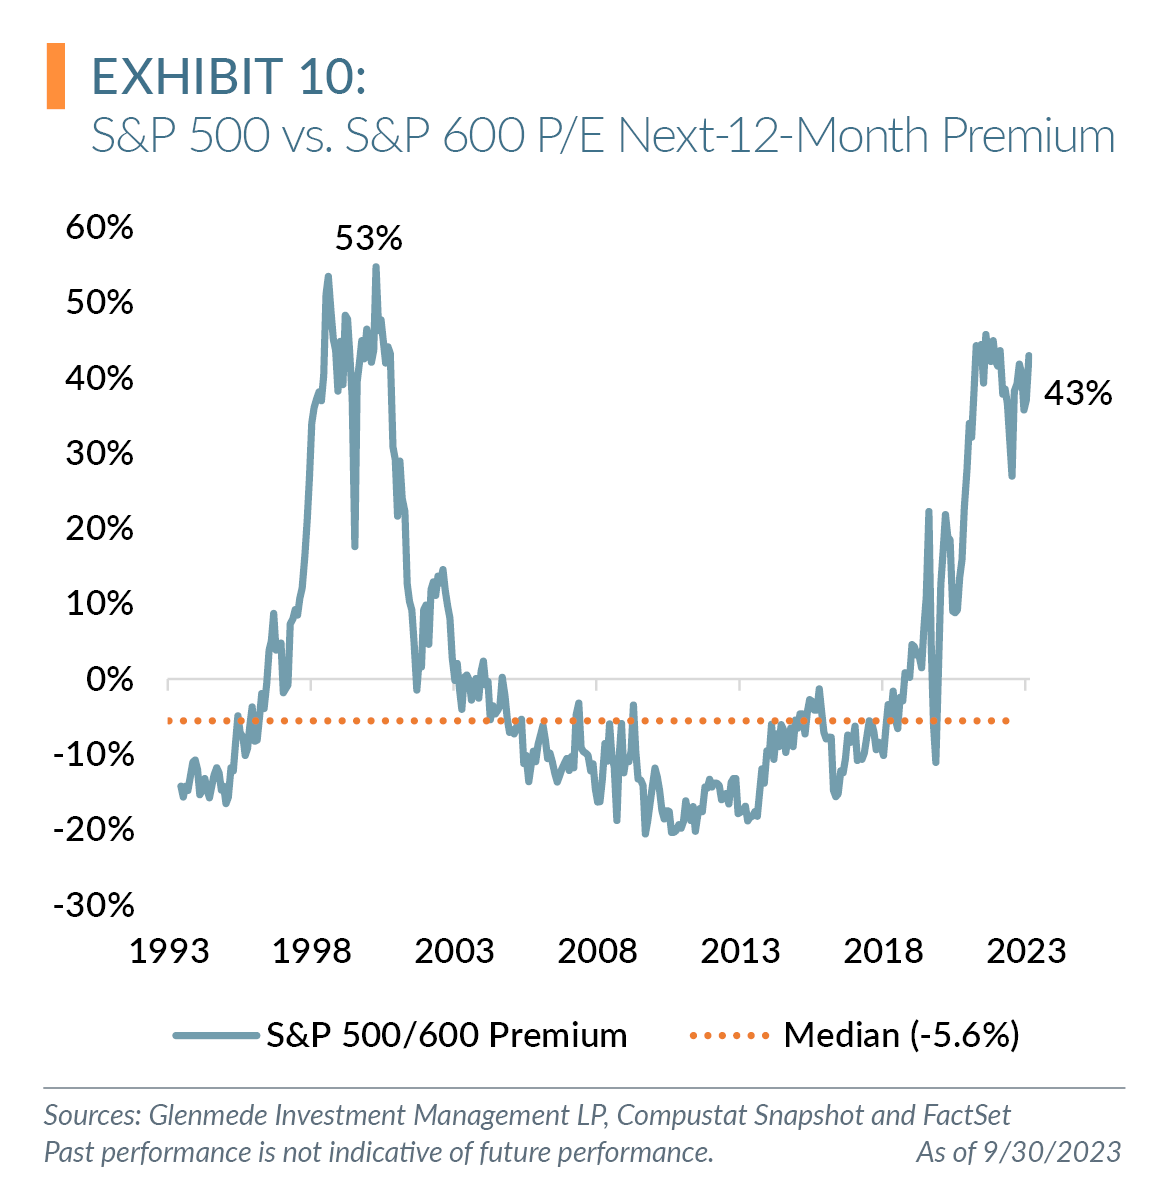
Specifically, the forward P/E of the S&P 500 is trading at 18.4x versus 12.9x for the S&P 600. The S&P 500 forward P/E ranks in the 74th percentile since 1993 and 85th percentile over the past 20 years compared to the S&P 600 ranking of 3.4% and 5.0%, respectively.
We would be remiss if we did not address the constituents of the S&P 500 relative to history and the impact on valuation. As noted in our Q2 3023 quarterly letter, the S&P 500 concentration of the top weights is near some of the highest levels observed over the past several decades.
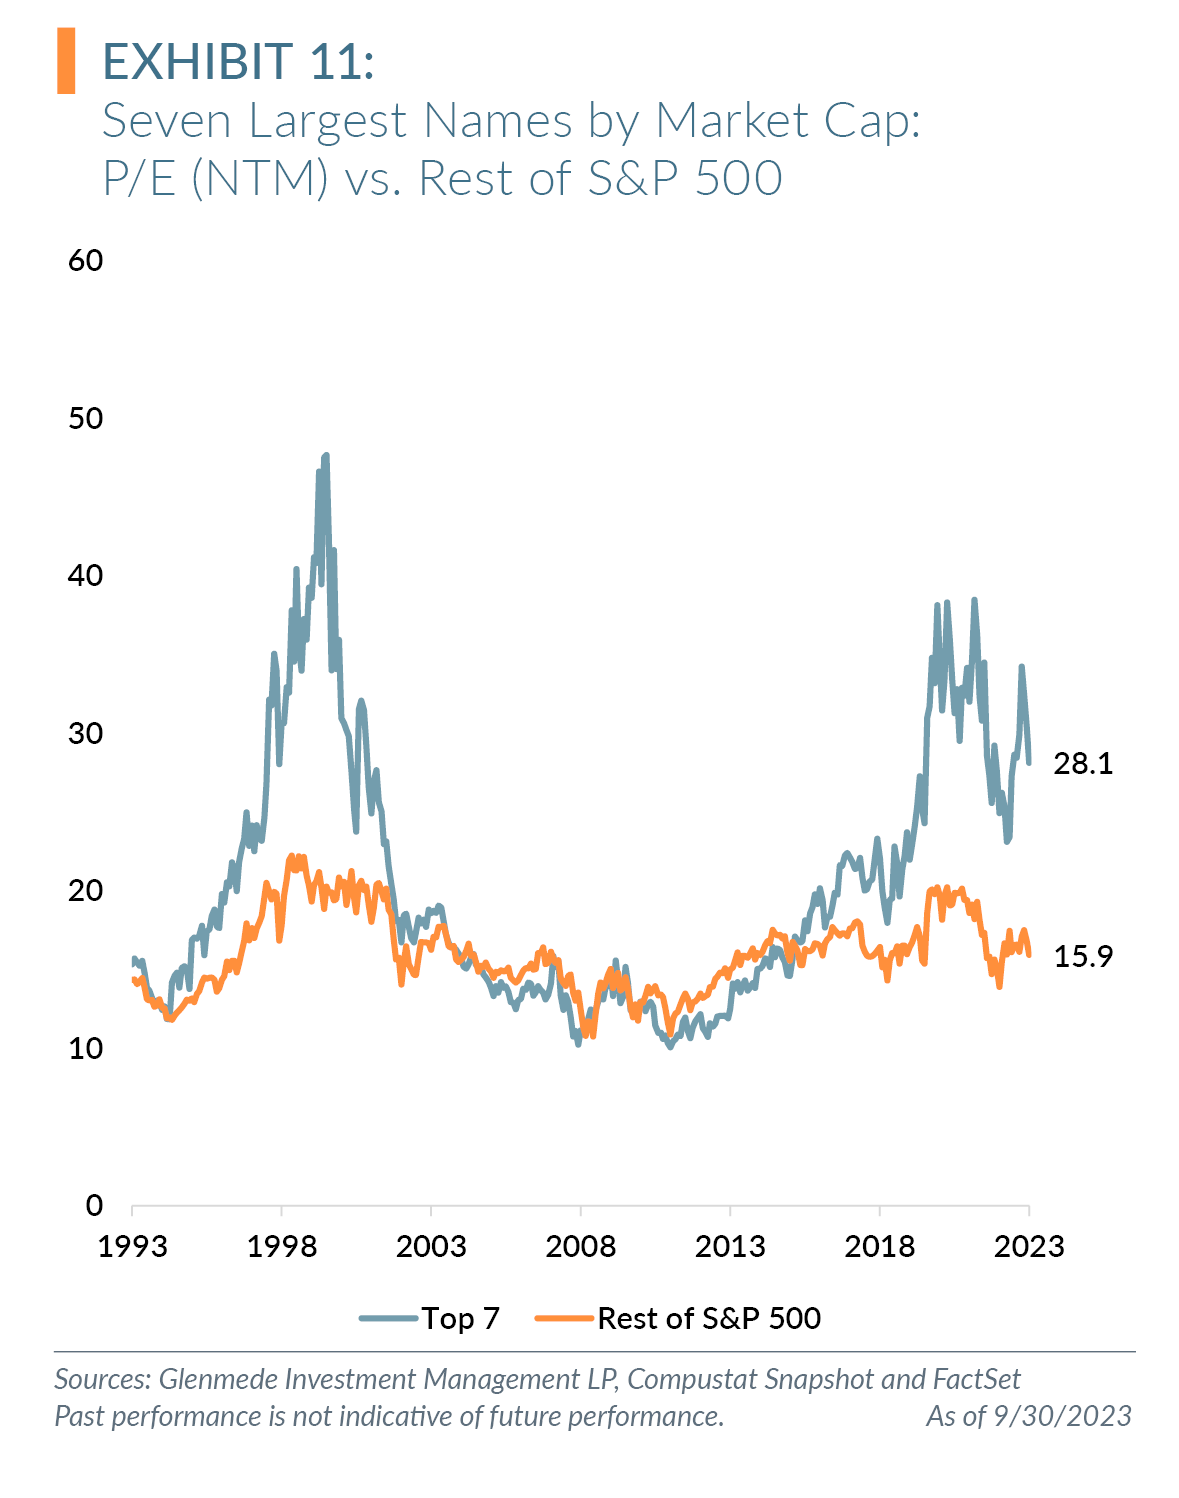
As shown in Exhibit 11, the forward P/E of the S&P 500 constituents excluding the Magnificent Seven is more in line with historical averages. The top seven weights currently trade at a forward P/E of 28.1x, ranking in the 81st percentile over the past 30 years and 87th percentile over the past 20. As of quarter end, the rest of the index trades at a forward P/E of15.9x, ranking in the 52nd percentile over the past 30 years and 56th percentile over the past 20.
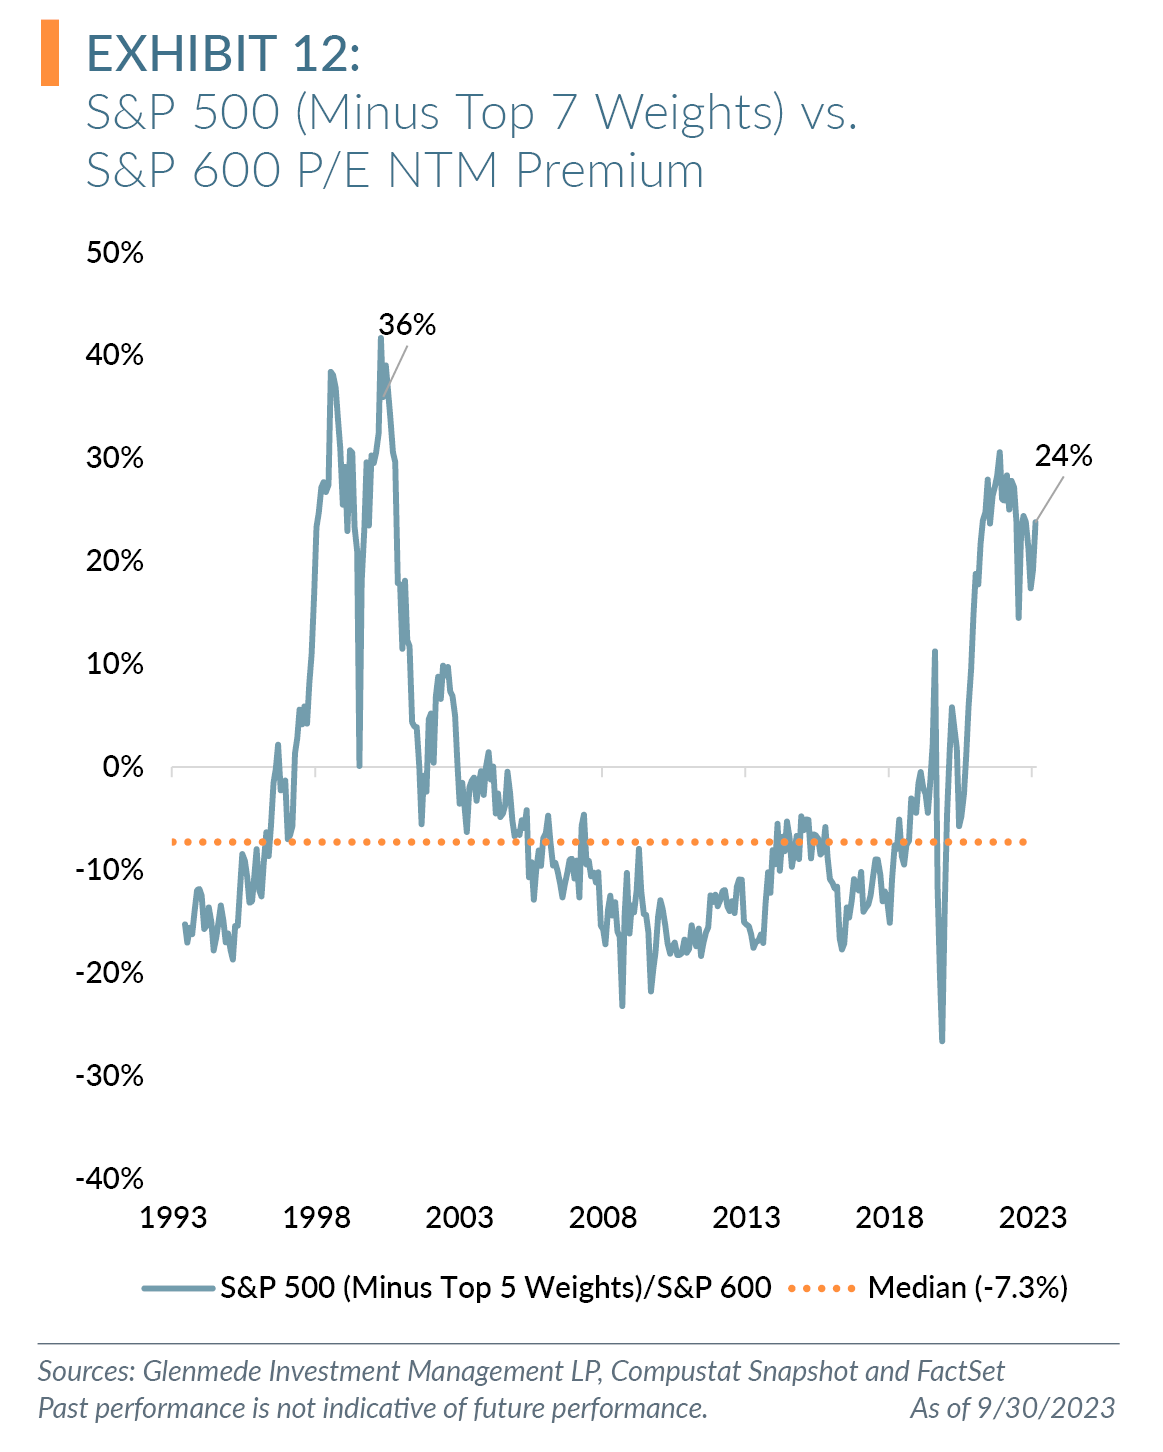
While removing the Magnificent Seven leaves a basket of stocks with historically inline average P/E multiples, this basket is still historically rich relative to the S&P 600. As shown in Exhibit 12, the remainder of the index after removing the top seven weights is at a 24% premium to the S&P 600 compared to the 30-year median discount of 7.3%. This premium is in the 88th percentile of observations over the past 30 years and 93rd percentile over the past 20. This confirms the argument that from a valuation perspective, even without the unique concentration of the S&P 500, the S&P 600 is still attractive on historical valuation premiums.
Why Small Cap Now?
When focused on higher quality, profitable small caps, the simplest answer is that current valuations are trading at previously deep recession levels. This suggests that some of the falling knife price expectations during a recession may already have some portion priced into the higher quality small caps.
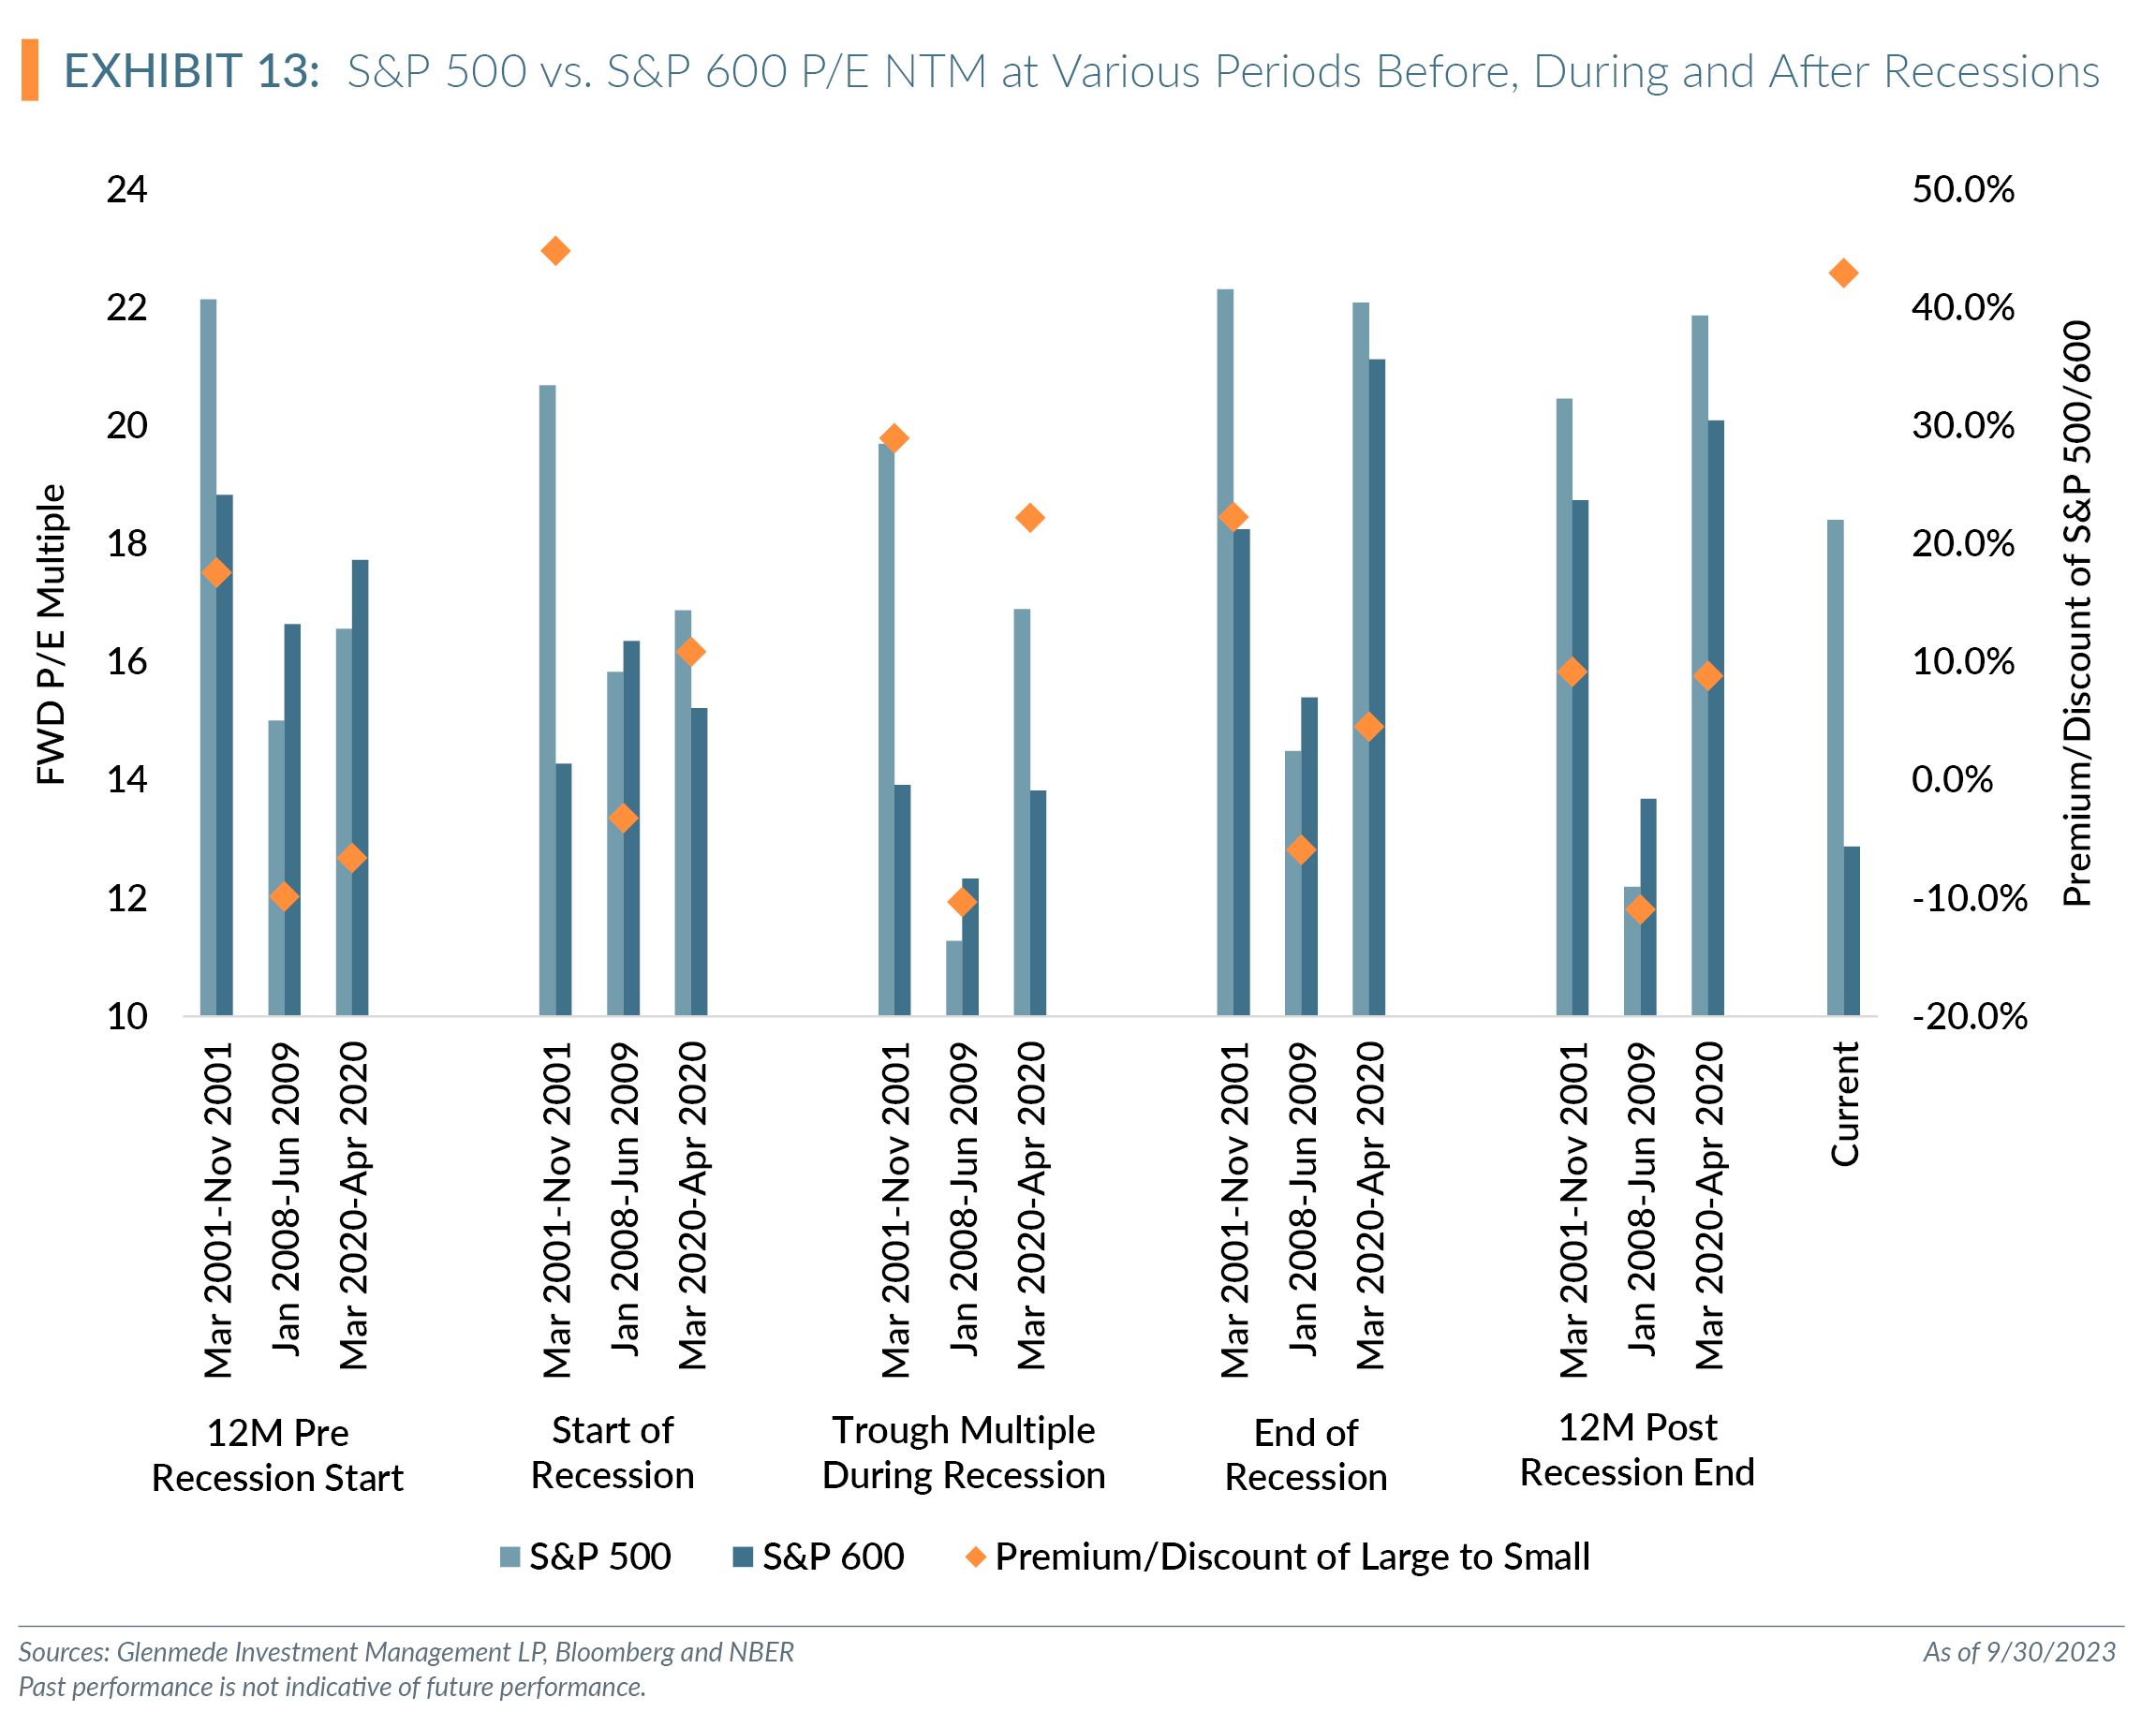
We compare the S&P 500 and S&P 600 forward P/E multiples ahead of the last three recessions (since available data). We chart the forward P/E multiples 12 months prior to the start of a recession, the start of the recession, the multiple trough during the recession, the end of the recession and 12 months after the end of the recession, based on NBER’s recession starts and ends. As shown in Exhibit 13, the current S&P 500 forward multiple of 18.4x is above the average multiple of each period for these three recessions, with the exception of when the recession ends. Conversely, the current S&P 600 forward P/E multiple of 12.9x is not only below the average of these periods but also near trough multiples of the recession post-global financial crisis. The current premium of S&P 500/600 is just shy of the premium at the start of the recession following the dot-com bubble burst, but above averages for all other periods.
Lastly, the opportunity set of profitable, quality small cap companies may become more prolific with the sharp increase in rates and the impact on the initial public offering market. In our report Negative Earners in Small Caps: The Saga Continues,5 we argue that the rapid increase in rates could curtail the number of negative-earning companies that go public or survive, as these higher rates will impact the viability of these companies. With fewer negative earners as constituents in the small cap space, and for active managers that focus on profitability, the performance differential between negative and positive earners should once again tilt in the direction of positive earners, the report notes.
Top Five Quarterly Charts
Our Quantitative Investment team produces many charts throughout the quarter. Here are what we view as the top five most interesting charts for this quarter.
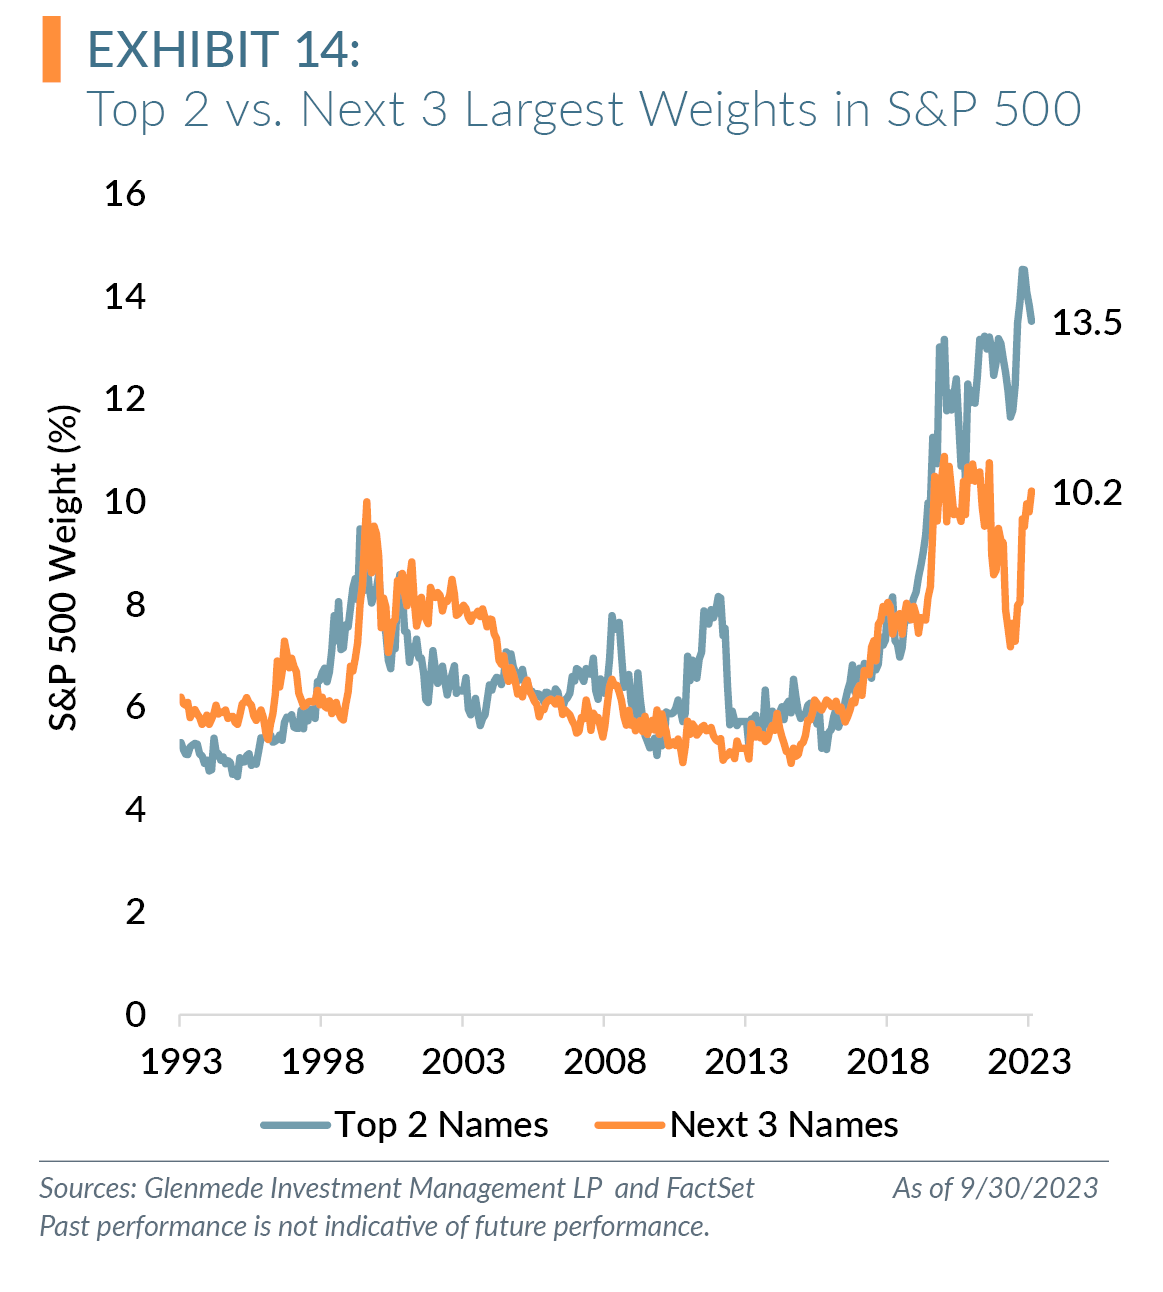
Description: Weight of the top two and next three constituents in the S&P 500.
Observations:
- The S&P 500 continues to remain concentrated with the top five weights accounting for 23.7% of the index.
- We continue to believe this concentration is a risk for passive allocations.
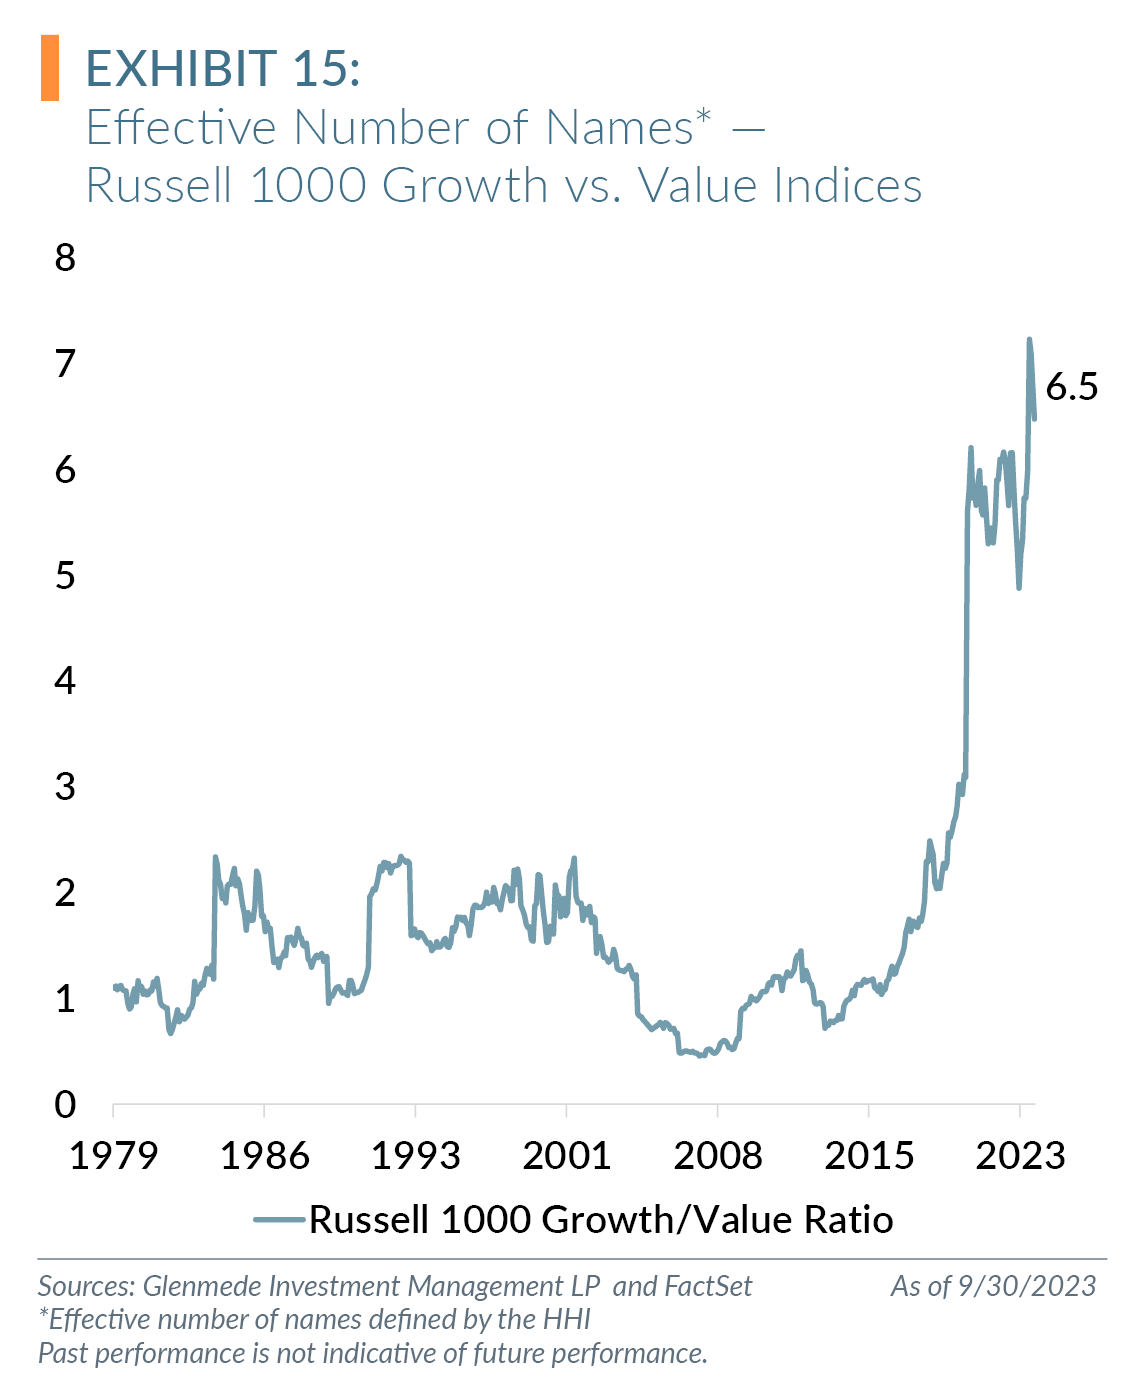
Description: The Herfindahl-Hirschman Index (HHI), a popular measure of market concentration, is calculated by squaring the market share of each firm. The “effective number of names” in an index is using the reciprocal of HHI. Based on these calculations, the Russell 1000 Growth Index has only 24 effective names, reaching an all-time low in June 2023. Meanwhile, the Russell 1000 Value Index has 163 effective names, near an all-time high. This chart graphs the historical ratio of Russell 1000 Growth to Value “effective” names.6
Observations:
- Using the HHI, the Russell 1000 Growth Index has never been as concentrated, and the Russell 1000Value Index has never been as diversified.
- We believe based on the effective names being at all-time lows and the sector concentration at all-time highs for the Russell 1000 Growth Index, it is becoming increasingly difficult to view the growth index as a diversified basket of stocks.
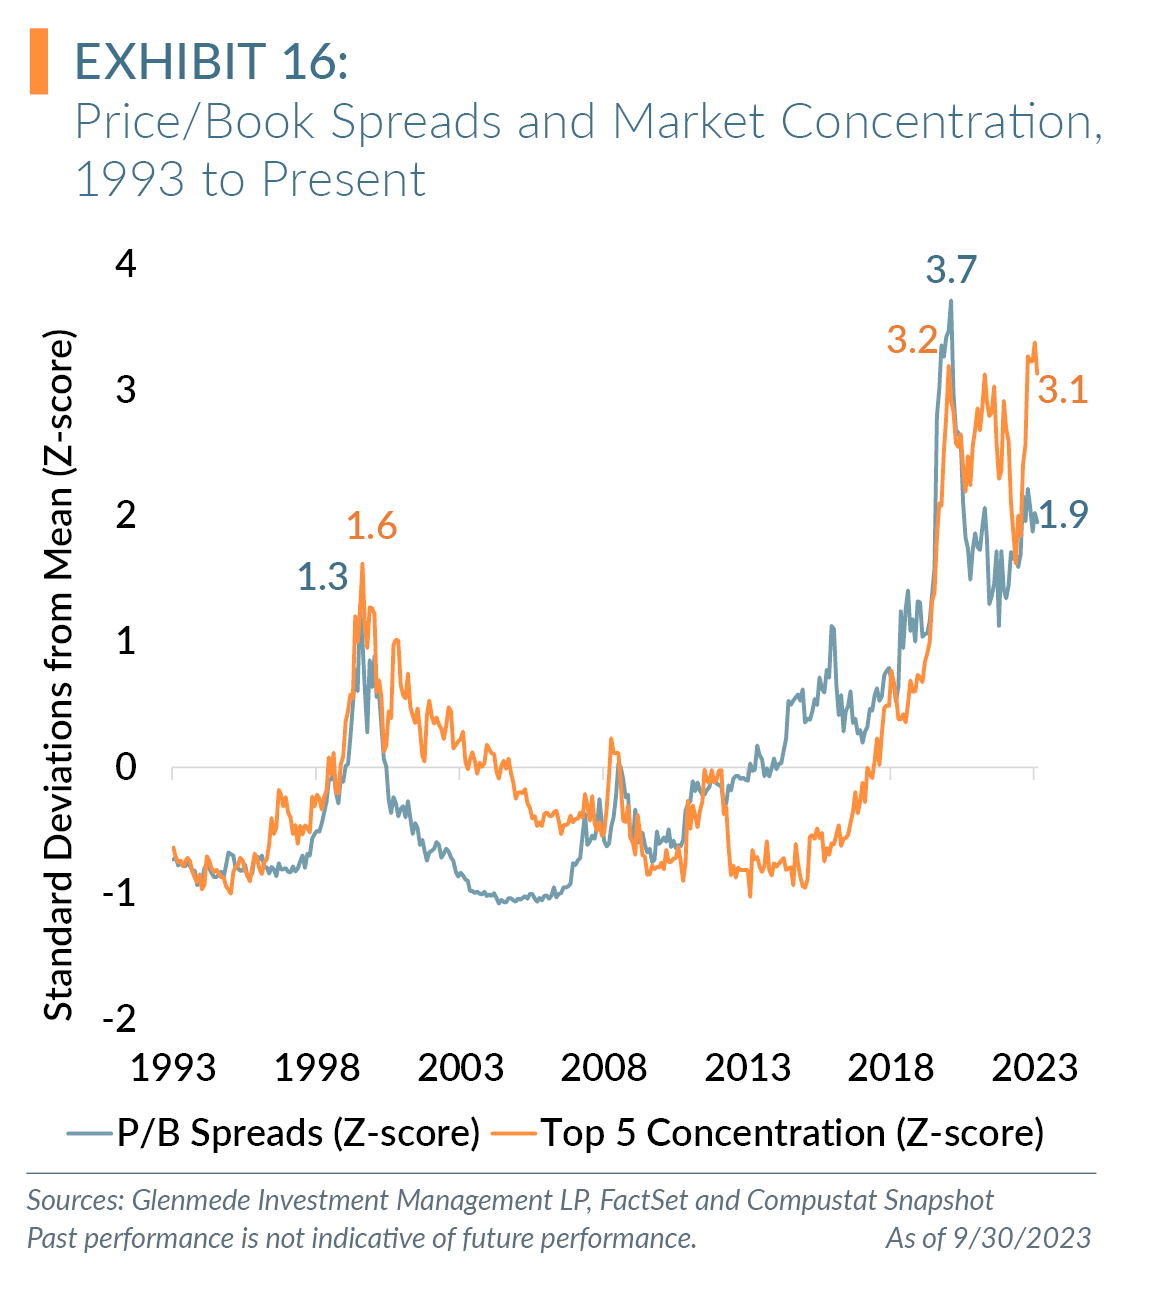
Description: This charts the standard deviation of price-to-book (P/B) spreads and market concentration (top five weights of the S&P 500 Index) of current observations of both since 1993. P/B spreads measure the most expensive quintile of price to book, divided by the least. Market concentration measures the aggregate weight of the largest five names in the S&P 500 Index. Both series are normalized by subtracting their means and dividing by standard deviation.
Observations:
- Concentration sits at a three standard deviation level over the past 30 years.
- While P/B spreads began to normalize in 2022, they remain elevated at 1.9 standard deviations.
- We continue to believe both concentration and valuation will normalize, creating risk to passive strategies that have exposure to both.
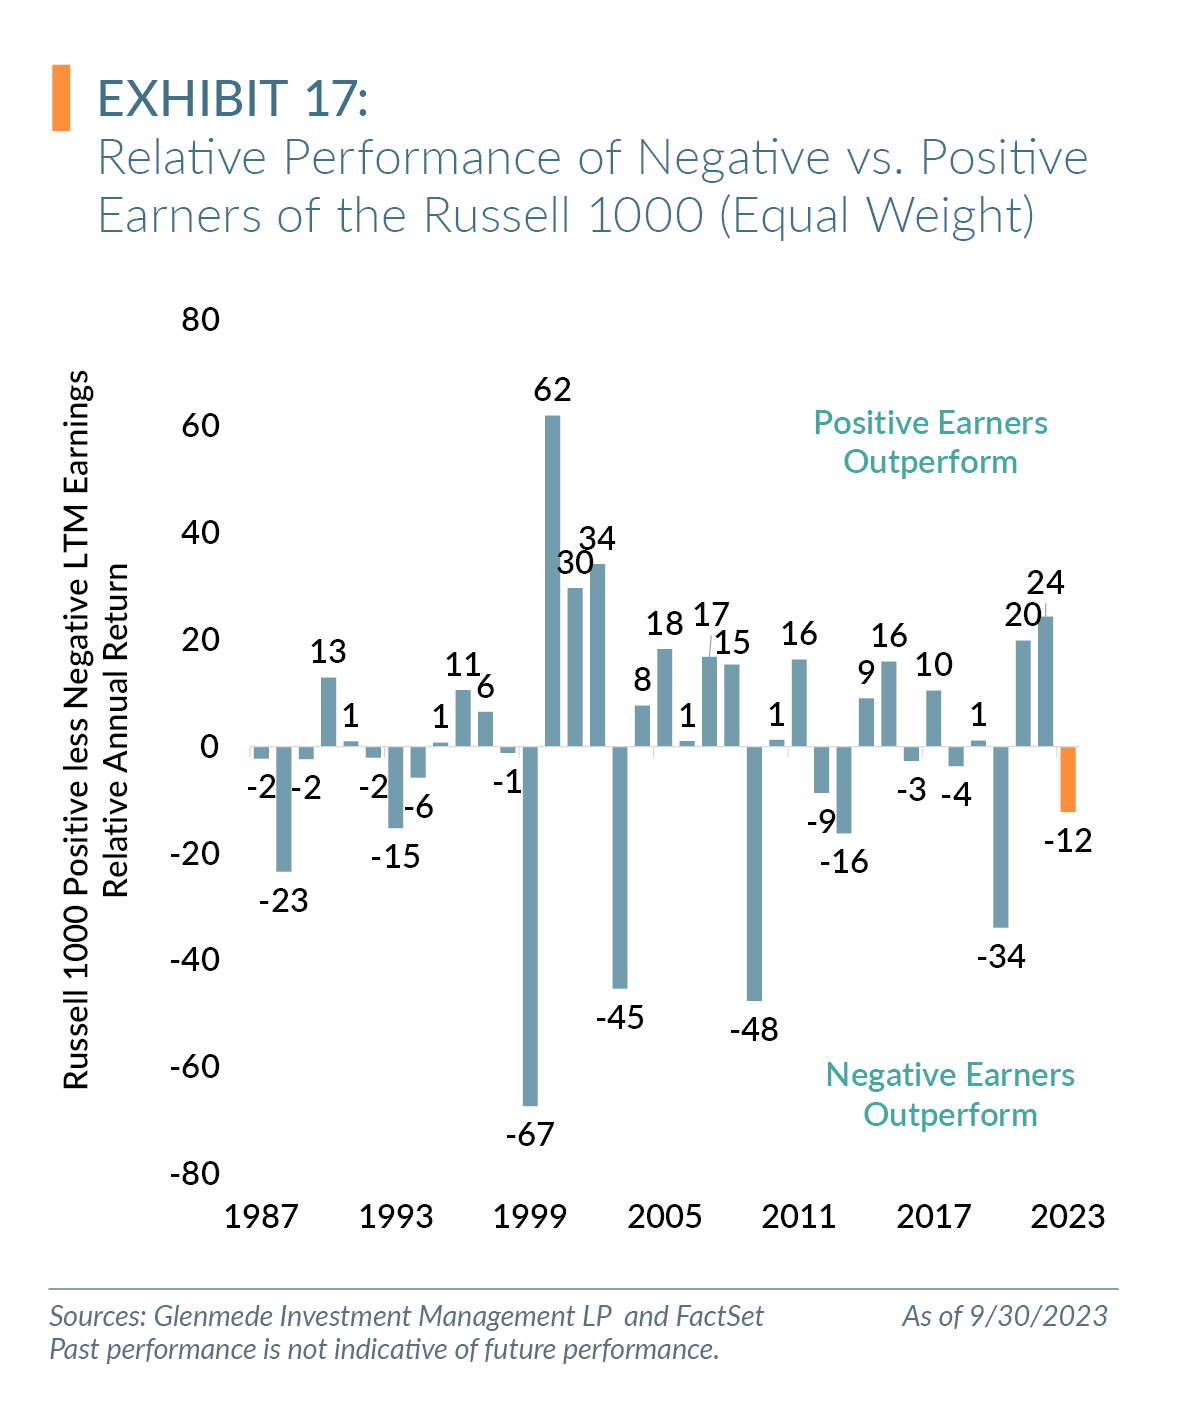
Description: The performance of positive versus negative earning companies in the Russell 1000 Index. We define a negative earner as any company without earnings over the trailing 12 months.
Observations:
- Over the past 35 years, investing in companies with positive earnings has been a successful strategy versus investing in companies with negative earnings, even as the Russell 1000 Index has had cyclical periods of negative earners outperforming positive earners.
- Since 1987, positive earners have outperformed negative earners by 4.7% annualized (11.7%annualized return for positive earners vs. 7.0%annualized return for negative earners).
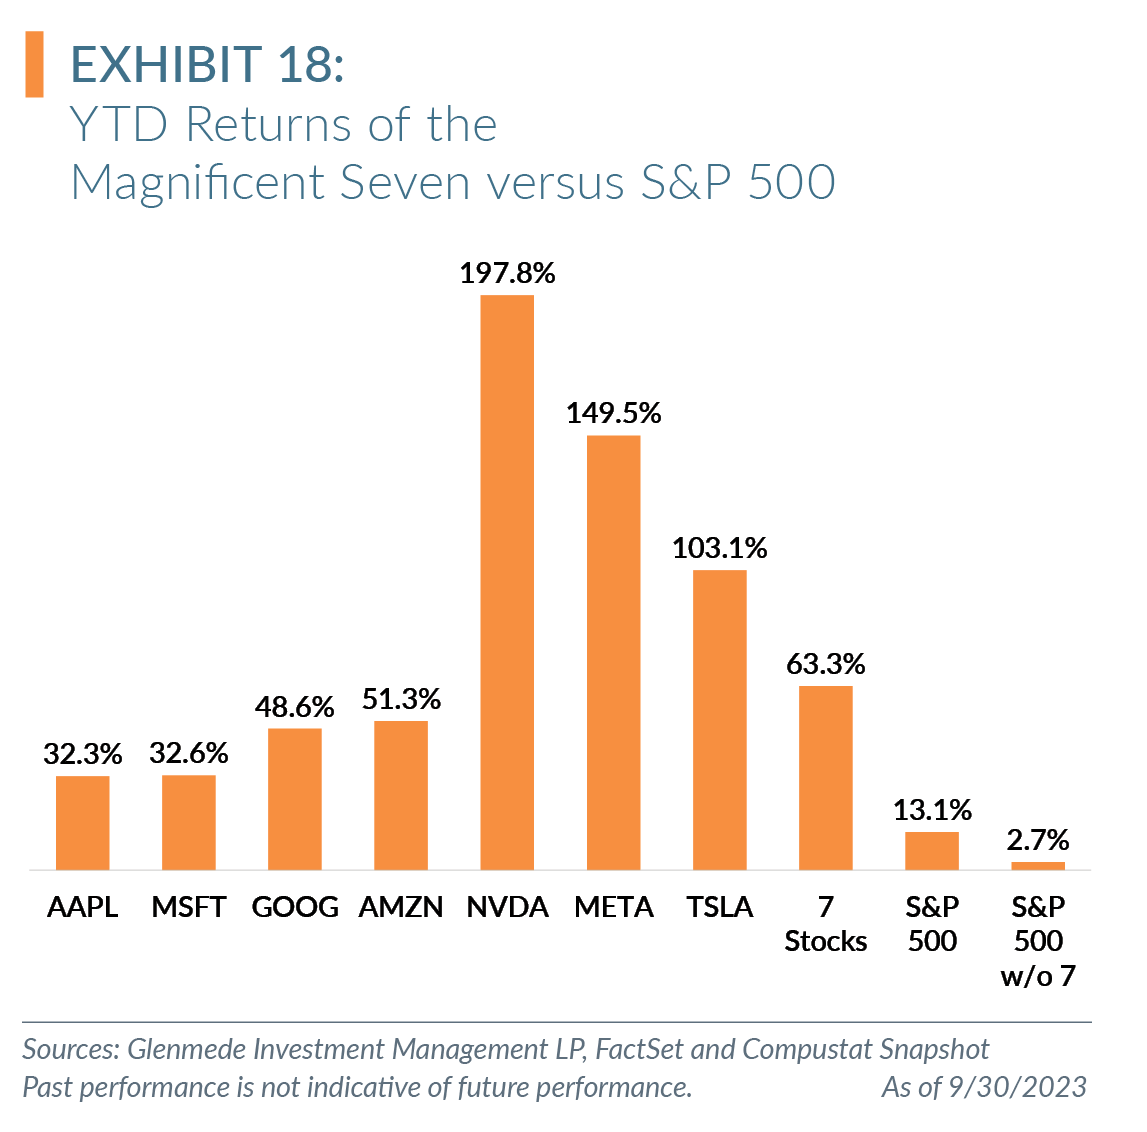
Description: YTD performance of the Magnificent 7 versus the S&P 500. The “7 stocks” represents the performance of owning these stocks rescaled based on their weight on the S&P 500. The S&P 500 without these seven stocks is a rescaled index excluding these stocks.
Observations:
- The S&P 500 continues to be dominated by a few names, which have explained the vast majority of the performance this year.
- The Magnificent Seven have contributed 84% of the 13.1% YTD total return of the S&P 500. earners by 4.7% annualized (11.7%annualized return for positive earners vs. 7.0%annualized return for negative earners).
1 https://www.newsweek.com/calling-recession-how-long-does-it-take-1735121.
2 S&P 500 closed at an all-time high of $4796.56 on January 3, 2022, compared to the closing price of $4588.96 on July 31, 2023 (4.3% price difference, excluding dividends). When including dividends, the index was within 1.9% of these highs on July 31, 2023, and 8.1% as of September 30, 2023.
3 We define a negative earner as any company without earnings over the trailing 12 months. For additional reading on negative earners, please see Why Profitability Matters: Positive versus Negative Earners and Negative Earners Could Create Positive Alpha for Active Strategies.
4 Brzenk, P., B. Hao, and A. M. Soe. “A Tale of Two Small-Cap Benchmarks: 10 Years Later.” S&P Dow Jones Indices, Sept. 27, 2019, https://www.spglobal.com/en/research-insights/articles/a-tale-of-two-small-cap-benchmarks-10-years-later.
5 Jordan, I. “Negative Earners in Small Caps: The Saga Continues,” Glenmede, September 19, 2023. https://www.glenmedeim.com/negative-earners-in-small-caps-the-saga-continues/.
6 “Market Snapshot: 445=24 When Indexing Does Not Diversity,” September 14, 2023.
All data is as of 9/30/2023 unless otherwise noted. Opinions represent those of Glenmede Investment Management LP (GIM) as of the date of this report and are for general informational purposes only. This document is intended for sophisticated, institutional investors only and is not intended to predict or guarantee the future performance of any individual security, market sector or the markets generally. GIM’s opinions may change at any time without notice to you.
Any opinions, expectations or projections expressed herein are based on information available at the time of publication and may change thereafter, and actual future developments or outcomes (including performance) may differ materially from any opinions, expectations or projections expressed herein due to various risks and uncertainties. Information obtained from third parties, including any source identified herein, is assumed to be reliable, but accuracy cannot be assured. This paper represents the view of its authors as of the date it was produced, and may change without notice. There can be no assurance that the same factors would result in the same decisions being made in the future. In addition, the views are not intended as a recommendation of any security, sector or product. Returns reported represent past performance and are not indicative of future results. Actual performance may be lower or higher than the performance set forth above.