The Quarterly Statement Q1 2024: Leaning Into Equal Weight and Small Cap
Market Review First Quarter 2024
What We Know: Q1 2024 Recap
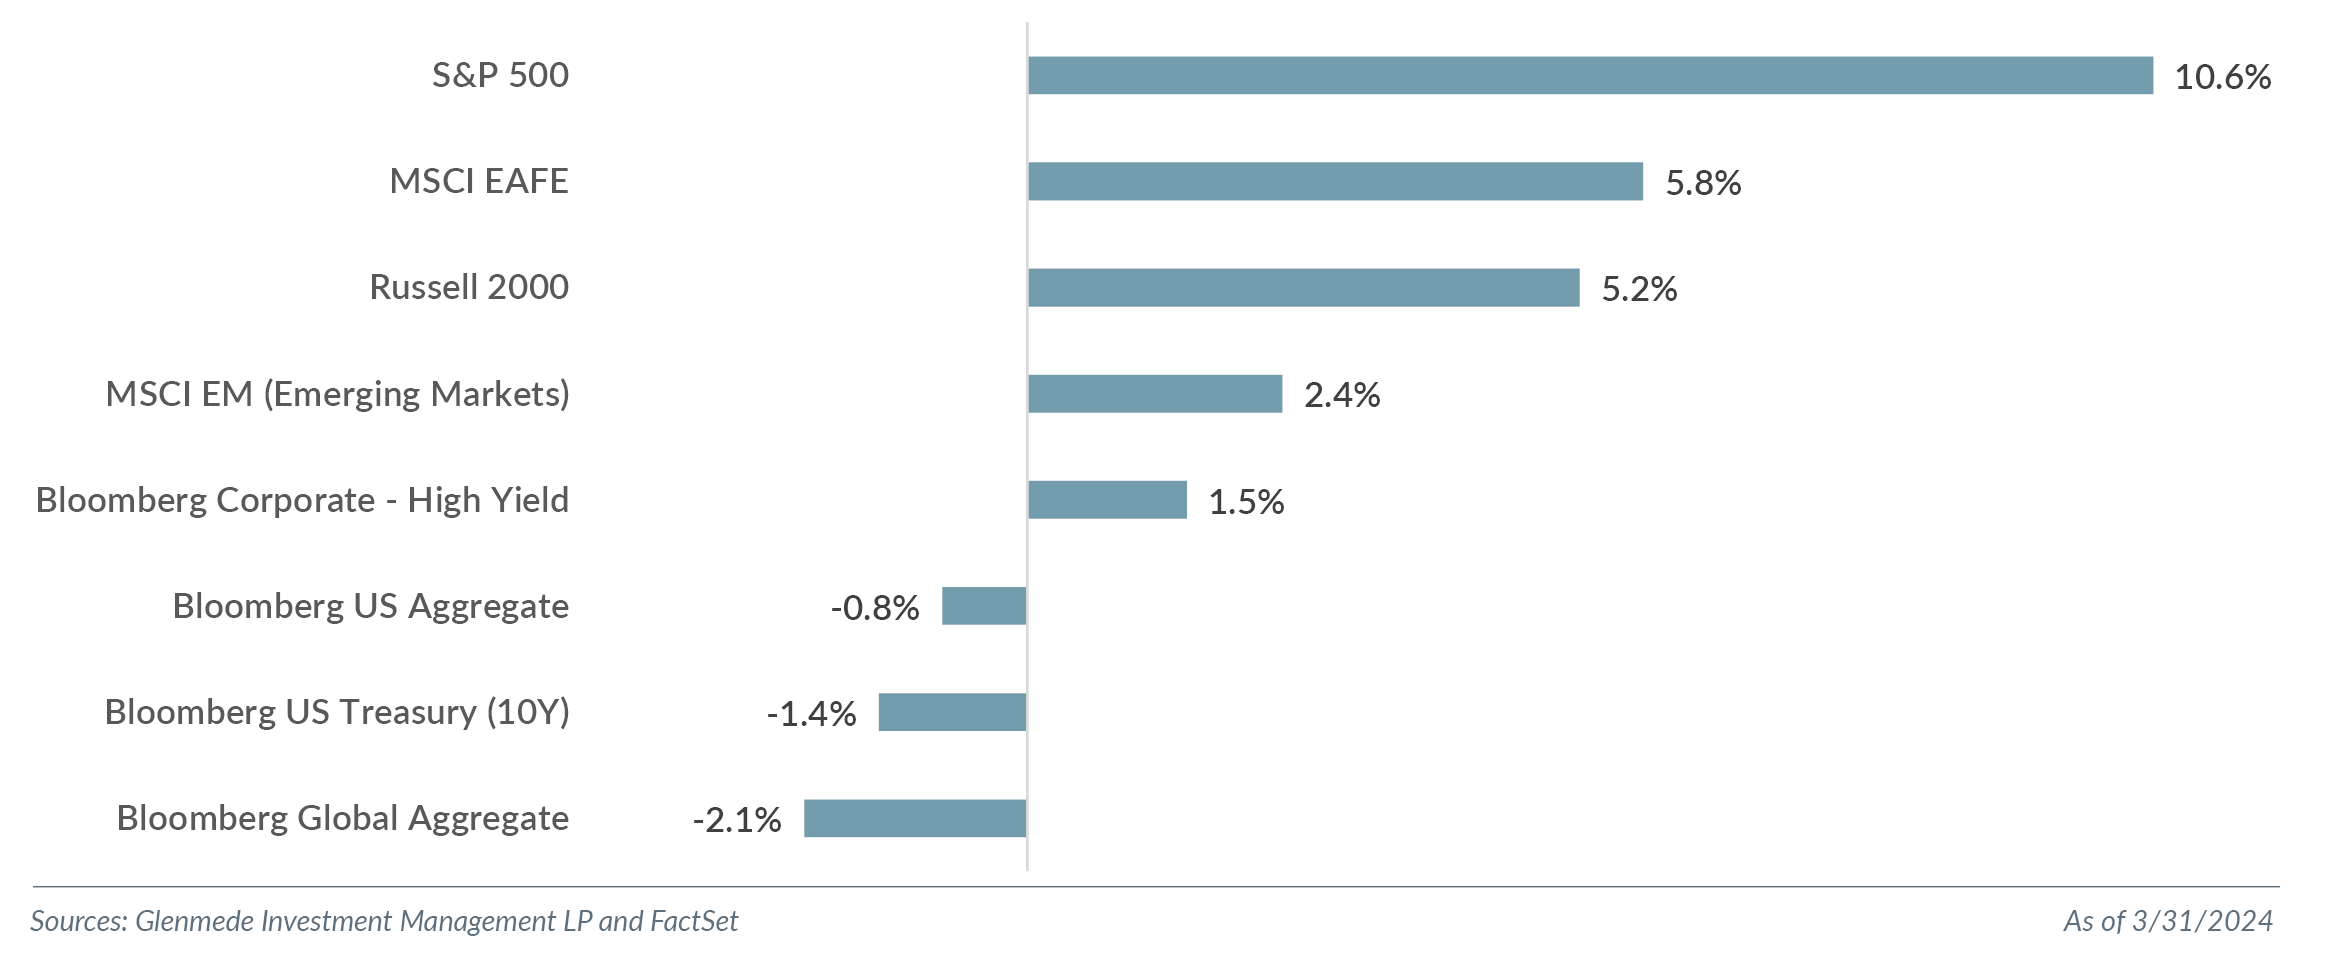
The equity bull market continued the rally in Q1 2024 as stronger economic data and corporate earnings supported investor beliefs in a soft landing. The U.S. equity rally persisted despite expectations that the Federal Open Market Committee (FOMC) would cut rates three times this year rather than the five cuts expected in Q4 2023 as potentially sticky inflation concerns remained. The S&P 500 finished the quarter with a positive return of 10.6%, the strongest start to the year since 2019, marking the first back-to-back quarterly returns for the S&P 500 of greater than 10% since Q1 2012. Back-to-back returns greater than 10% have occurred 10 other times since 1970, with an average one-year forward return of the S&P 500 of 10.5% and 80% positive frequency. The “Magnificent Seven” (Apple Inc., Microsoft Corporation, Alphabet Inc., Amazon.com, Inc., NVIDIA Corporation, Tesla, Inc. and Meta Platforms, Inc.) were mixed, with Tesla (-29.3%) and Apple (-10.8%) experiencing negative returns and Nvidia (+82.5%) and Meta (+37.3%) the standouts. These seven stocks accounted for 36.9% of the S&P 500 return for the quarter compared to the 62% contribution for 2023.
Value (Russell 1000 Value Index) continued to lag growth (Russell 1000 Growth Index) this quarter with returns of 9.0% and 11.4%, respectively. Given mega caps’ contribution, growth has outperformed value for the past five quarters by 37.5%, the seventh time since 1979 value has underperformed for this long. This quarter end also represented the fourth worst five quarter underperformance of value relative to growth since 1979 (the three worst performing five quarter periods are Q4 1999 -43.6%, Q3 2020 -43.3%, and Q4 2020 -42.8%). In each of the three previous instances, value outperformed growth over the next five quarters (+39.8%, 3.3% and 8.1%, respectively).
Ten of the 11 sectors of the S&P 500 finished in the black this quarter, with the REIT sector the only negative with -0.6% total return. The Communication Services sector was the top performer, returning 15.8% for the quarter and bringing 1-year returns to 49.8%. Magnificent Seven cohorts Meta and Alphabet were the notable contributors to the return. Energy, 13.7%, and Information Technology, 12.7%, were the next two best performing sectors.
Small cap continued to lag large cap this quarter (Russell 2000 total return of 5.2% versus S&P 500 of 10.6%). In 10 of the past 12 quarters, small cap has underperformed large cap with a total return difference of 38.9% and annualized return difference of 11.6%.¹ In other words, the Russell 2000 is basically at the same level it was at the end of Q1 2021, while the S&P 500 has rallied 38.5% over that period. Small cap value (Russell 2000 Value Index) returned 2.9%, reverting to underperforming growth (Russell 2000 Growth Index at 7.6%) after back-to-back quarters of outperformance.
While international markets were positive this quarter, they still lagged their domestic counterparts. Developed international (MSCI EAFE Index) returned 5.8%, and international emerging markets (MSCI Emerging Markets Index) returned 2.4%. This has been the trend over the last year, with the MSCI EAFE Index returning 15.9% and MSCI Emerging Markets Index, 8.5% since Q1 2023.
The U.S. Treasury 2Y-10Y curve flattened in the first quarter with the 2Y yield rising 37 basis points to yield 4.62%, and the 10Y yield higher by 32 basis points to yield 4.20%. The U.S. Treasury 10Y-2Y yield spread, a much-watched recessionary indicator, finished the quarter at -42 basis points, widening slightly from Q4 2023 of -37 basis points.
What We Debate: A Practitioner’s Perspective
“People, it turns out, are not that averse to risk. For many reasons, they are not opposed to risk, but they are opposed to losing and the possibility of loss plays a very significant part in their decision.” – Daniel Kahneman
Although mean reversion arguments are some of the more easily hypothesized, we highlight two areas of the U.S. equity market that continue to stretch to extremes and present potential investing implications: equal weight versus market cap weight and large versus small.
Equal Weight Versus Market Cap Weight
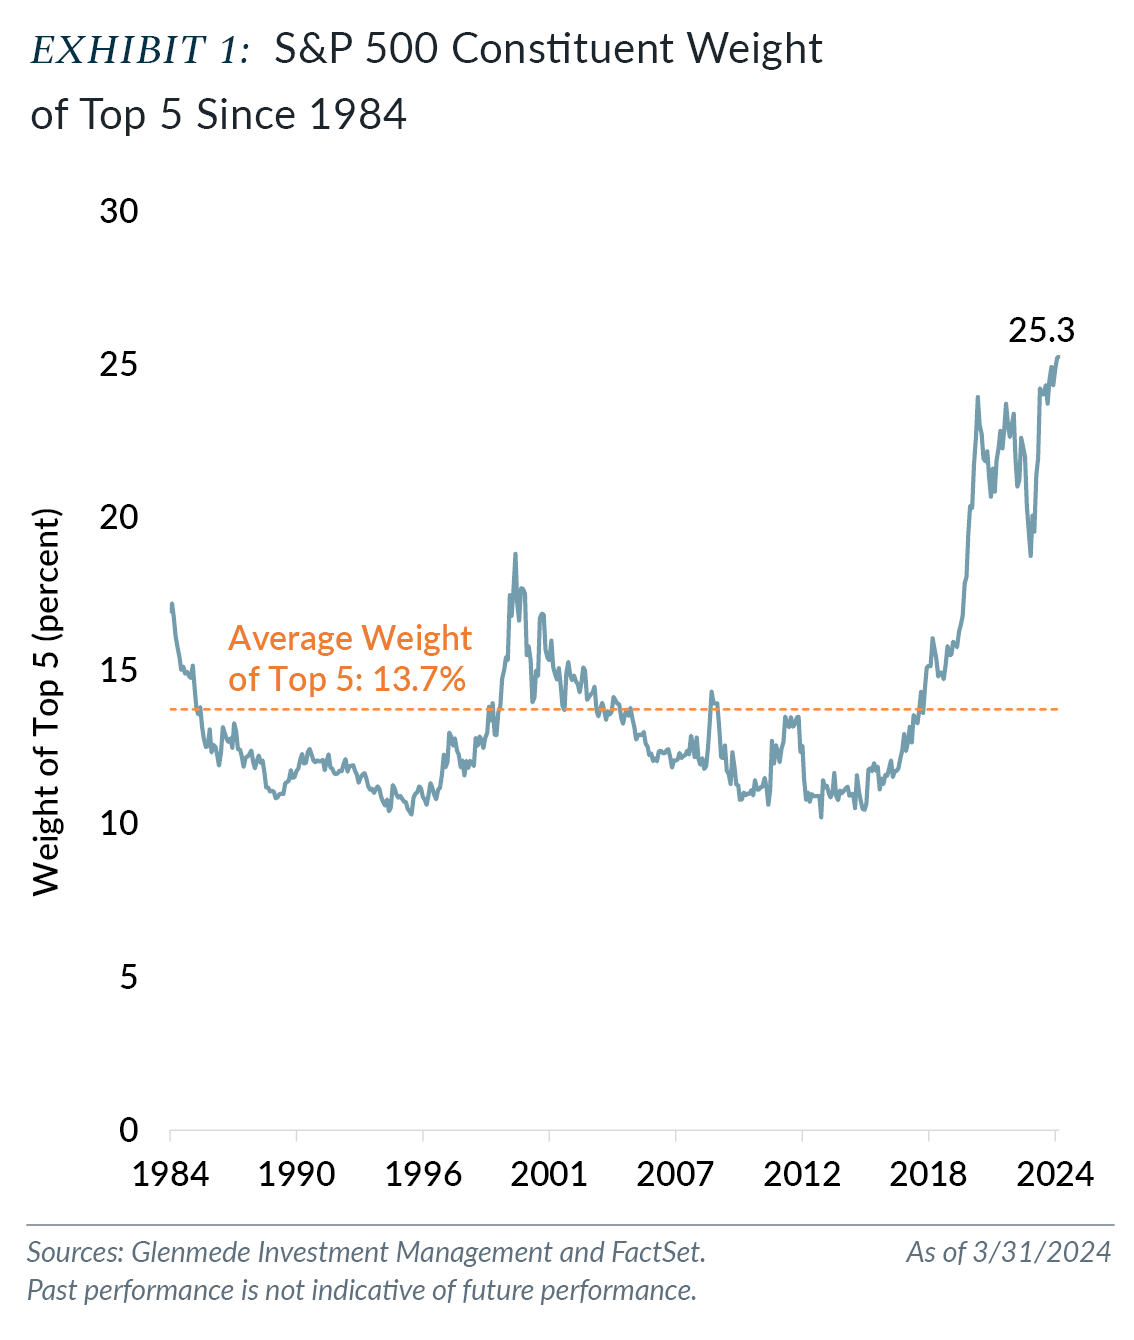
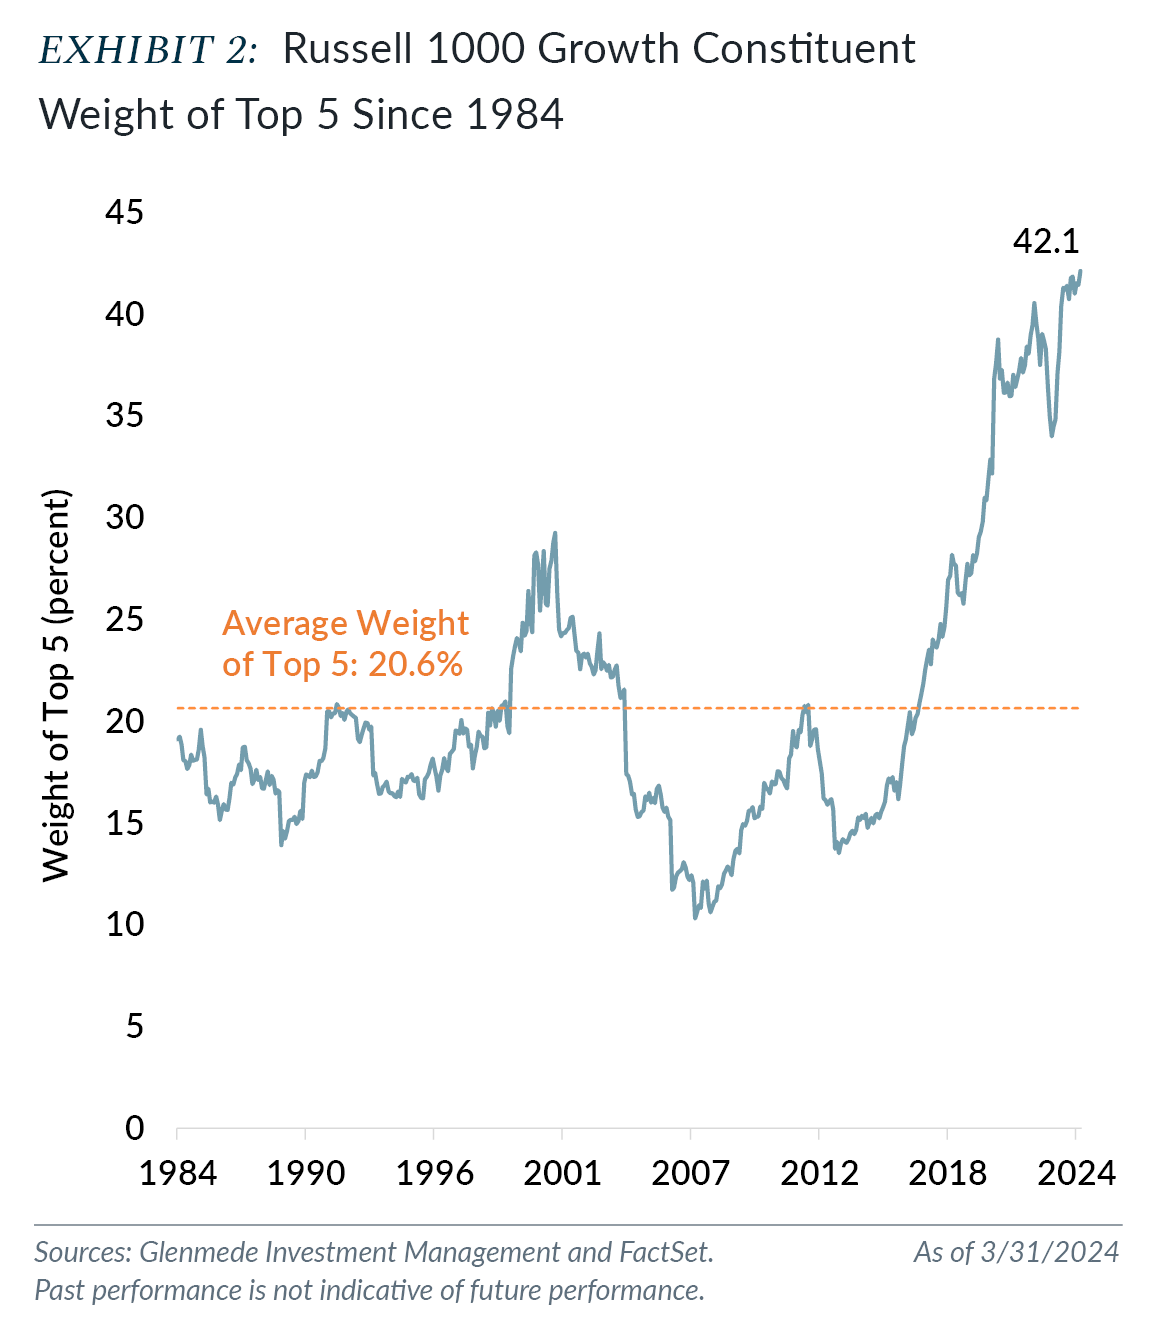
We have discussed market concentration² of U.S. indices and the concentration risks inherent in passive allocations to U.S. large cap strategies. As of quarter end, the top five names in each of the S&P 500 and Russell 1000 Growth accounted for 25.3% and 42.1% of the indices, respectively, as shown in Exhibits 1 and 2. These levels are a 40-year high for the S&P 500 and all-time high concentration for the Russell 1000 Growth. The lack of diversification has grown, insidiously, over the last decade. The S&P 500 has more than doubled the weight of the top five in the past decade (11.0% end of Q1 2014) and increased more than 65% in the past five years (15.4% end of Q1 2019). The Russell 1000 Growth has almost tripled the weight of the top five constituents in the past decade, increasing from 14.5% at the end of Q3 2014. Just five years ago at the end of Q1 2019, the top five weights represented 26.9% of the index. Despite markets becoming even more concentrated in 2023, investors moved $192.8 billion into large cap blended passive funds while redeeming a net $48.6 billion from actively managed funds. According to Morningstar, passively managed funds (including exchange-traded funds and notes) surpassed actively managed assets in 2023 ($13.3 trillion in assets for passive versus $13.2 trillion for active).
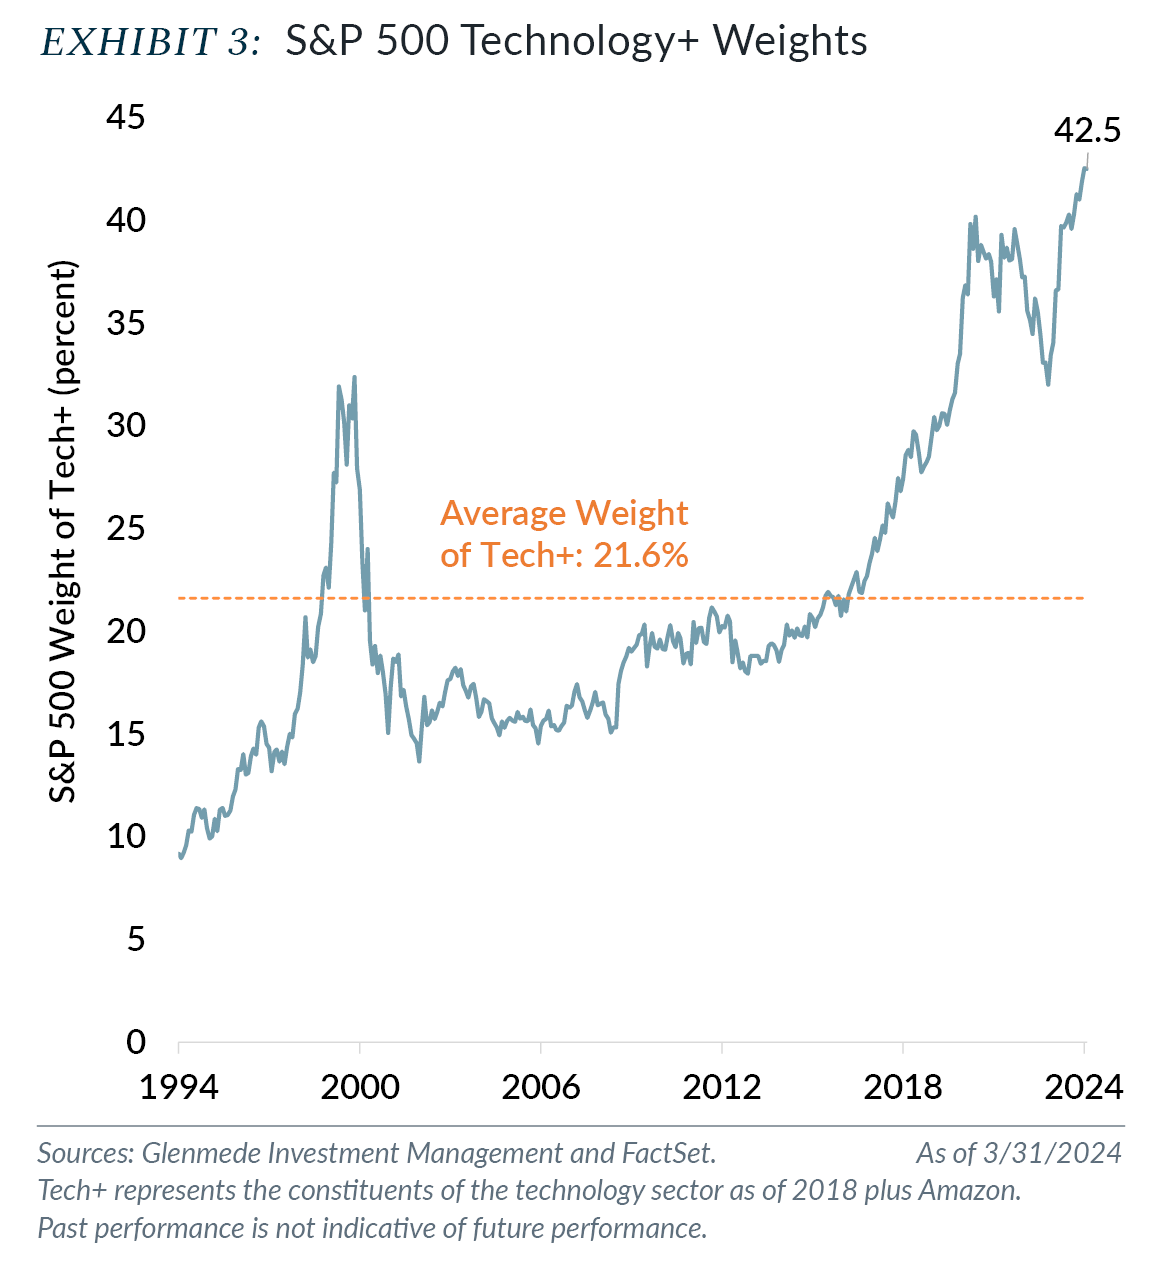
We believe that market-cap based indices may offer a reasonable representation of the broader stock market performance over time. However, our concern continues to be the structure of these indices in that the driver for increasing weight is increasing stock price (increasing market cap driven by increasing stock price which results in a higher index weighting). The previously noted herding behavior into passive has exacerbated the demand for the higher weighted stocks relative to smaller weights in the indices. This demand and the structure of the market-cap based indices has resulted in a more concentrated “top heavy” market. The intent of these broad-based indices is to offer diversification across stocks, sectors and industries. With no guardrails for stock or sector exposure, investors may find themselves with exposure to less diversification than intended. In fact, the S&P 500 has a 42.5% weight to the constituents of the Information Technology sector as of 2018 plus Amazon (we define as Tech+). This weight is at all-time highs and double the average weighted exposure investors have had since 1994.
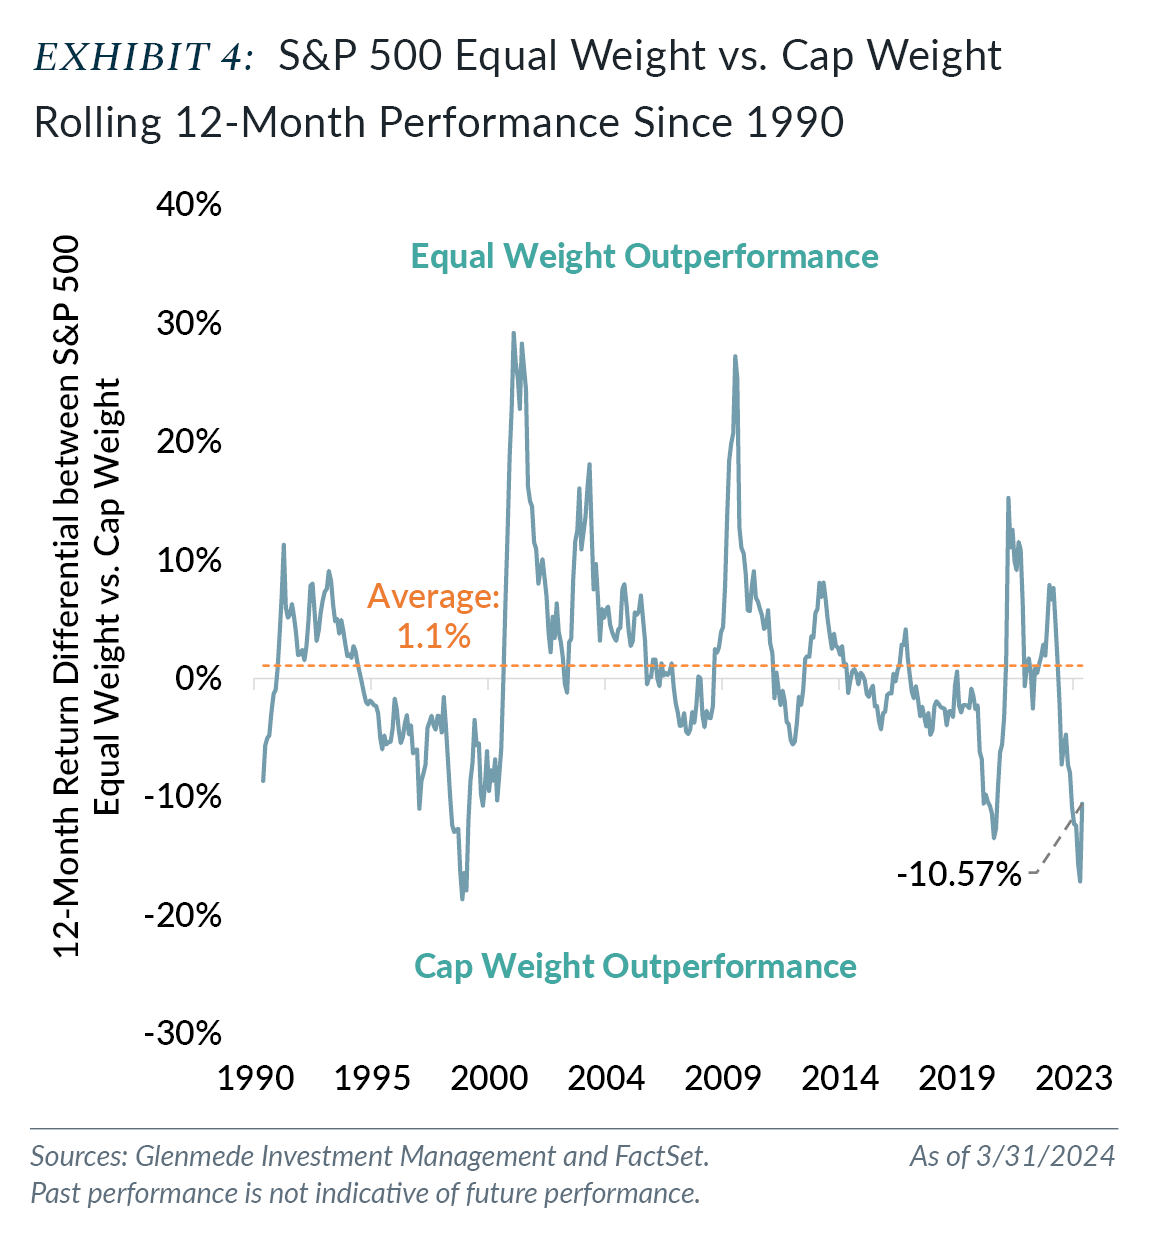
The concentration in the market cap indices has resulted in a notable return differential of S&P 500 equal weight versus cap weight over the past year, highlighted in Exhibit 4. As of the end of February, the 12-month return differential was a 17.1% underperformance of equal weight to cap weight, an underperformance level not seen since the peak of the dot-com frenzy in Q1 1999. With the roll-off of March 2023 performance and the pick-up of March 2024 return when equal weight outperformed cap weight, the quarter finished with a 12-month underperformance of equal weight relative to cap weights of 10.6%, the 22nd worst 12-month performance since 1989. While the timing of the reversion has varied historically, the speed of the snapback has been notably faster than the period of underperformance, suggesting that waiting for the snapback to begin may result in missing the majority of the reversion.
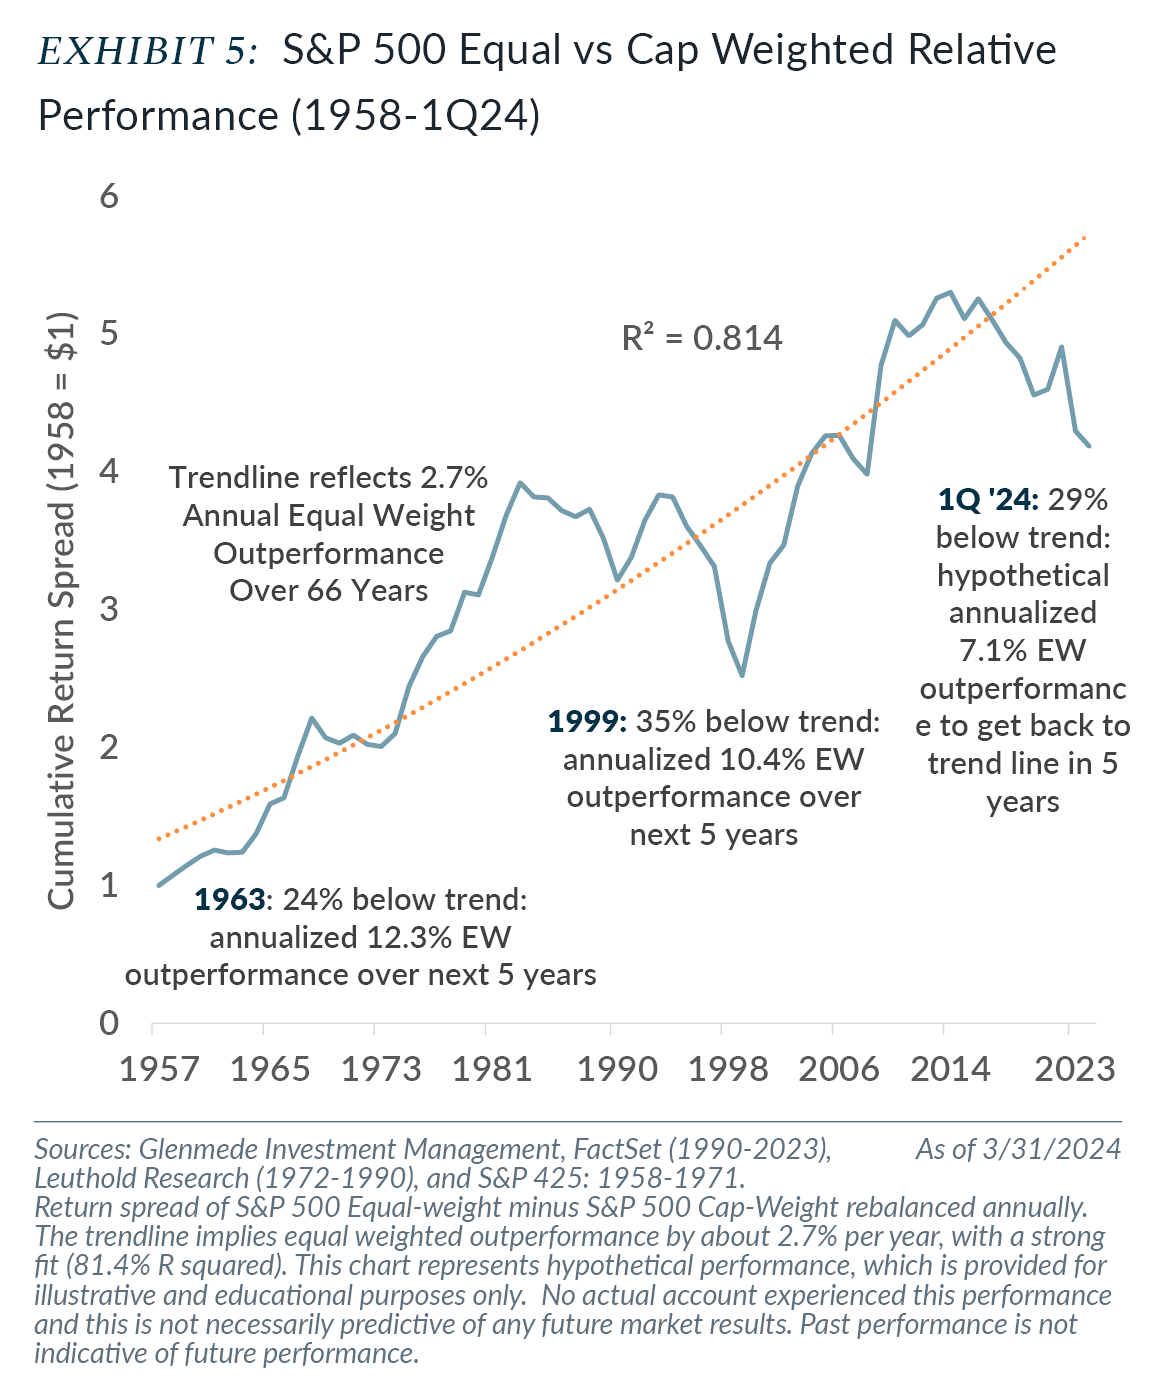
As an alternative analysis on the underperformance of equal weight to cap weight, we include an update of our February 8, 2024, Market Snapshot: An Equal Opportunity Market. Exhibit 5 looks at the growth of $1 of the S&P 500 Equal Weight versus Cap Weight since 1958 through Q1 2024, rebalanced annually. As of quarter end, the relative underperformance of equal weight versus cap weight has fallen to 29% below the trend line,³ the third period in the past 66 years to experience a divergence from trend of more than 24% (previous periods include 1963 and 1999). Following the two previous periods of divergence, equal weighted S&P outperformed by 12.3% and 10.4% per year for five years, respectively (cumulative 5Y relative returns were 78% and 64%). Assuming a return to trend, the S&P equal weighted index would need to outperform by 7.1% per year over the next five years.
While timing mean reversion is a fool’s errand, we believe recognizing the risk and exposure when the deviation is notable is necessary. Even when the divergence is at historical extreme levels, we acknowledge that it could continue but believe that slowly diversifying away from the exposure is prudent. Given the current dislocation of equal weight to cap weight and the concentration risk to passive large cap market-cap based indices, we believe allocating to strategies with a more equal weighted approach offers diversification from concentration risk and the potential period of underperformance of the market cap passive indices over the next several years. Specifically, we continue to believe diversifying some of the passive large cap exposure to actively managed large cap strategies that are well diversified with limits on individual stock exposures may offer a more attractive risk-adjusted return for longer term investors.
Large Versus Small
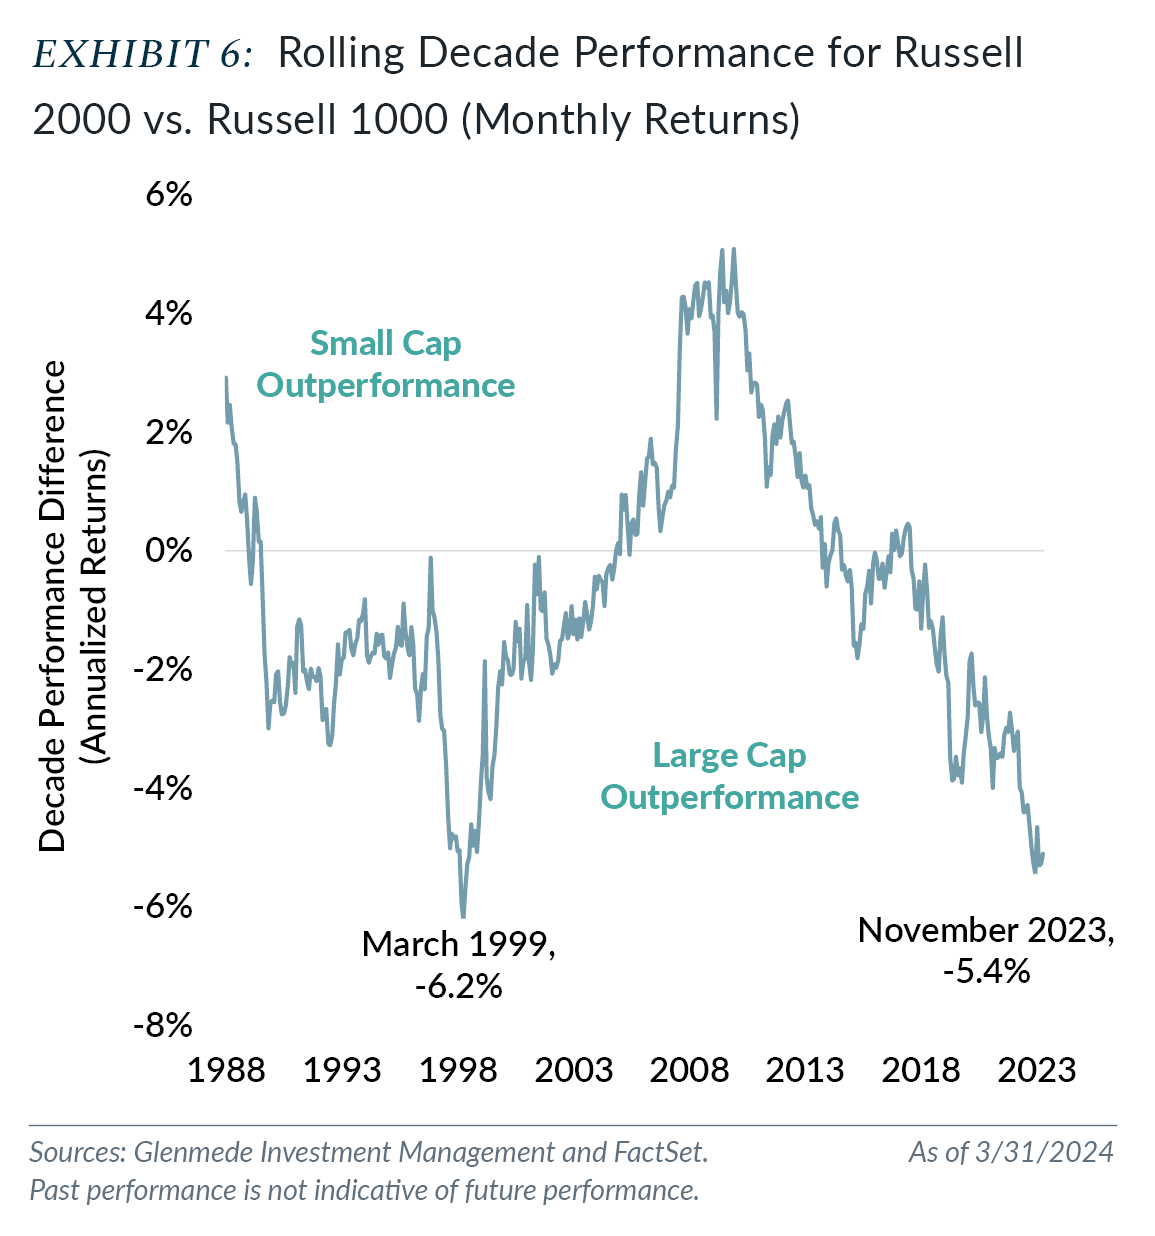
In our Q3 2023 Quarterly Statement, we discussed our belief of why allocating to small cap was attractive. While we may have been early on the normalization of small cap relative to large cap, we continue to believe small cap has the potential to outperform large cap in the coming years. Using another mean reversion argument, Exhibit 6 compares a decade’s return of the Russell 2000 (small cap) to Russell 1000 (large cap). As of quarter end, large cap has outperformed small cap by 122.4% over the past decade, or 5.1% annualized (Russell 1000 returns of 229.6% cumulative and 12.7% annualized versus Russell 2000 of 107.2% cumulative and 7.6% annualized). The current period of small cap under performance to large cap rivals the period during the internet bubble, with peak underperformance of 6.2% in March 1999.
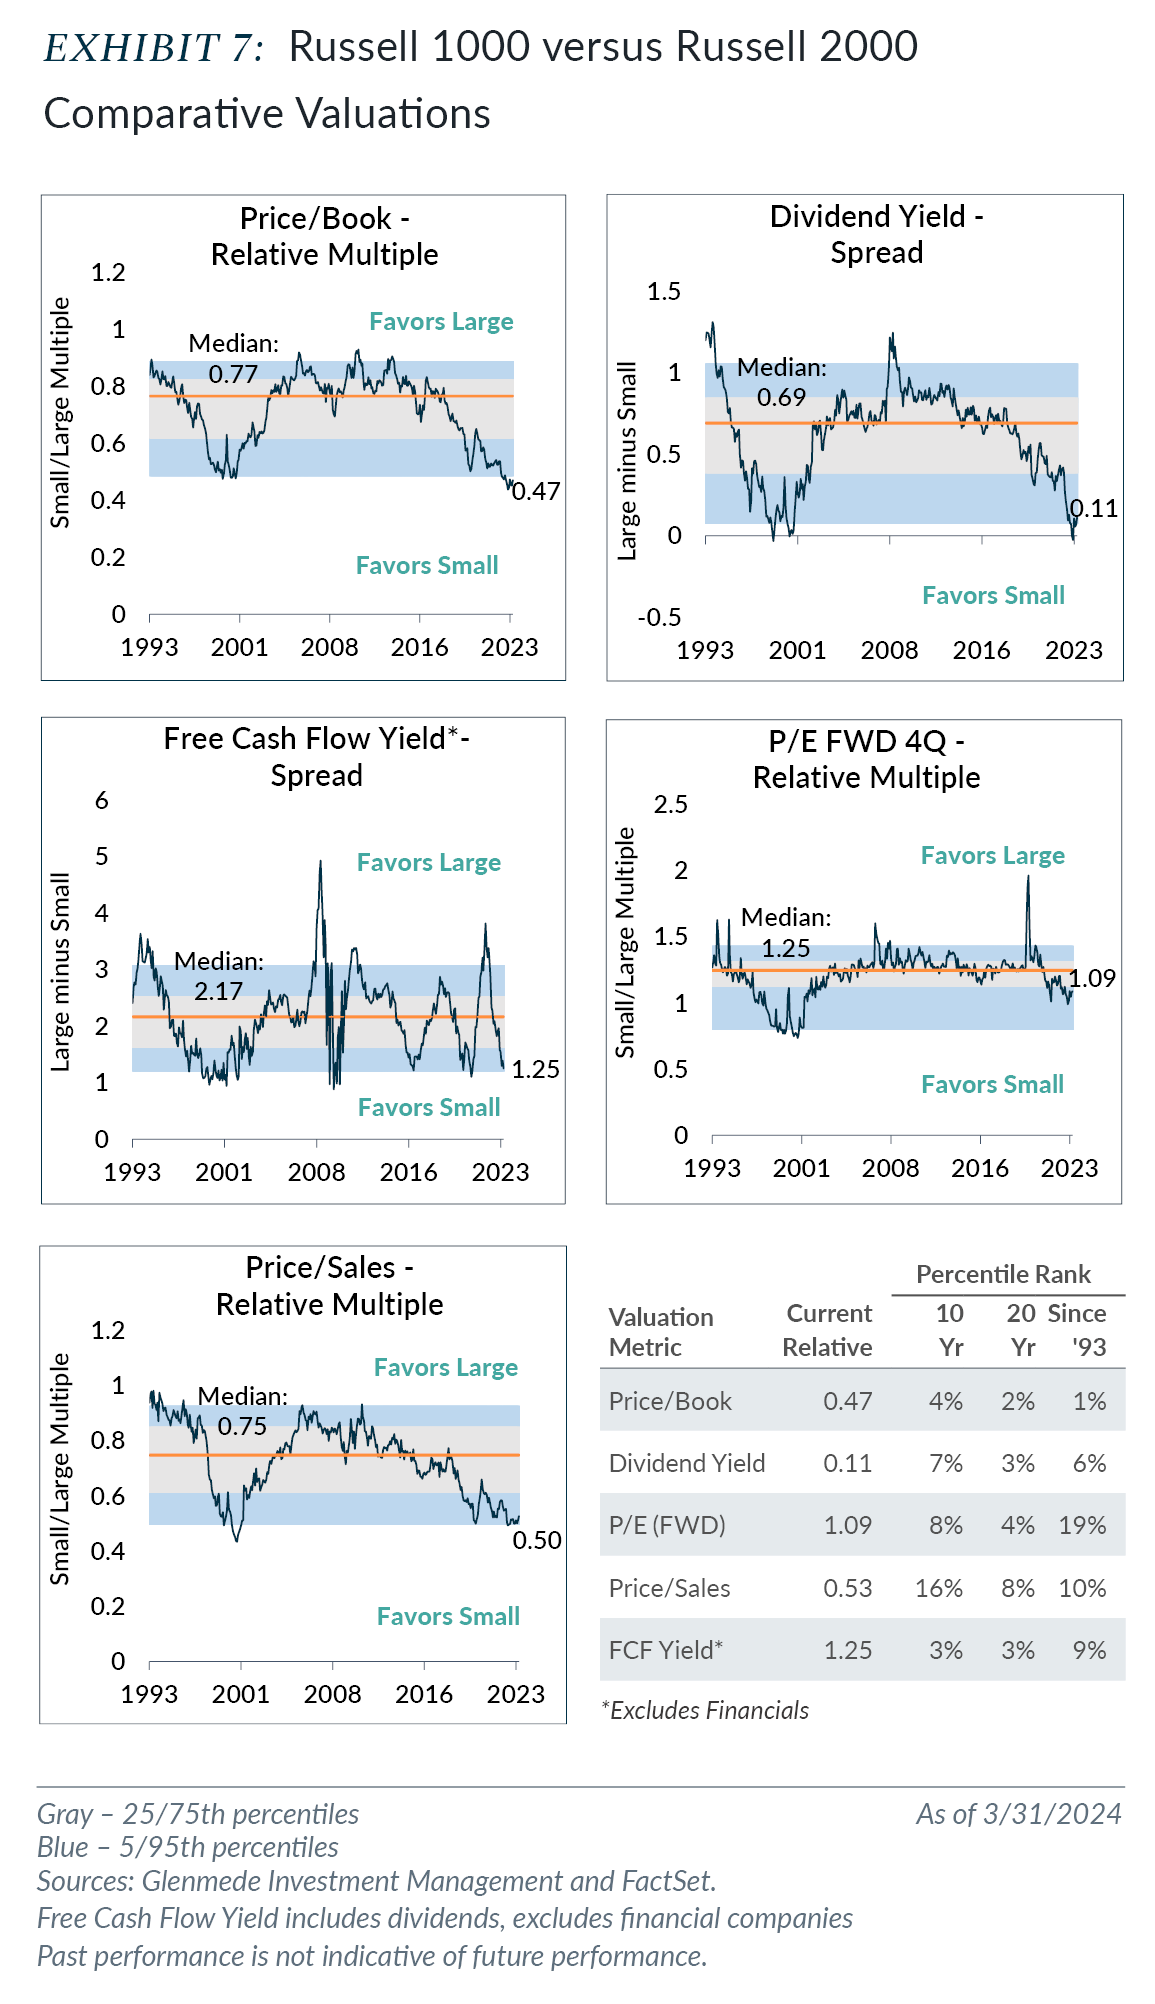
While we noted that mean reversion would be the argument, valuation also supports allocating to small cap. Using available data since 1993, the Russell 2000 is trading nearest its lowest price-to-book (P/B) multiple relative to the Russell 1000. Dividend yield, price/sales and FCF yield are also near historic lows with percentile rankings of 6%, 10% and 9%, respectively. While all observations are in the bottom 20th percentile since 1993, 12-month forward price/earnings (NTM P/E) is the most expensive in the 19th percentile of observations.
While Russell 2000 versus Russell 1000 valuations are compelling, one of the concerns we have noted is the negative earners4 component in the Russell 2000. As of quarter end, approximately 24.7% of the index were negative earners, well off the month-end peak of 41.3% in January 2021. However, this is still above the longer-term average since 1993 of 20.3%.
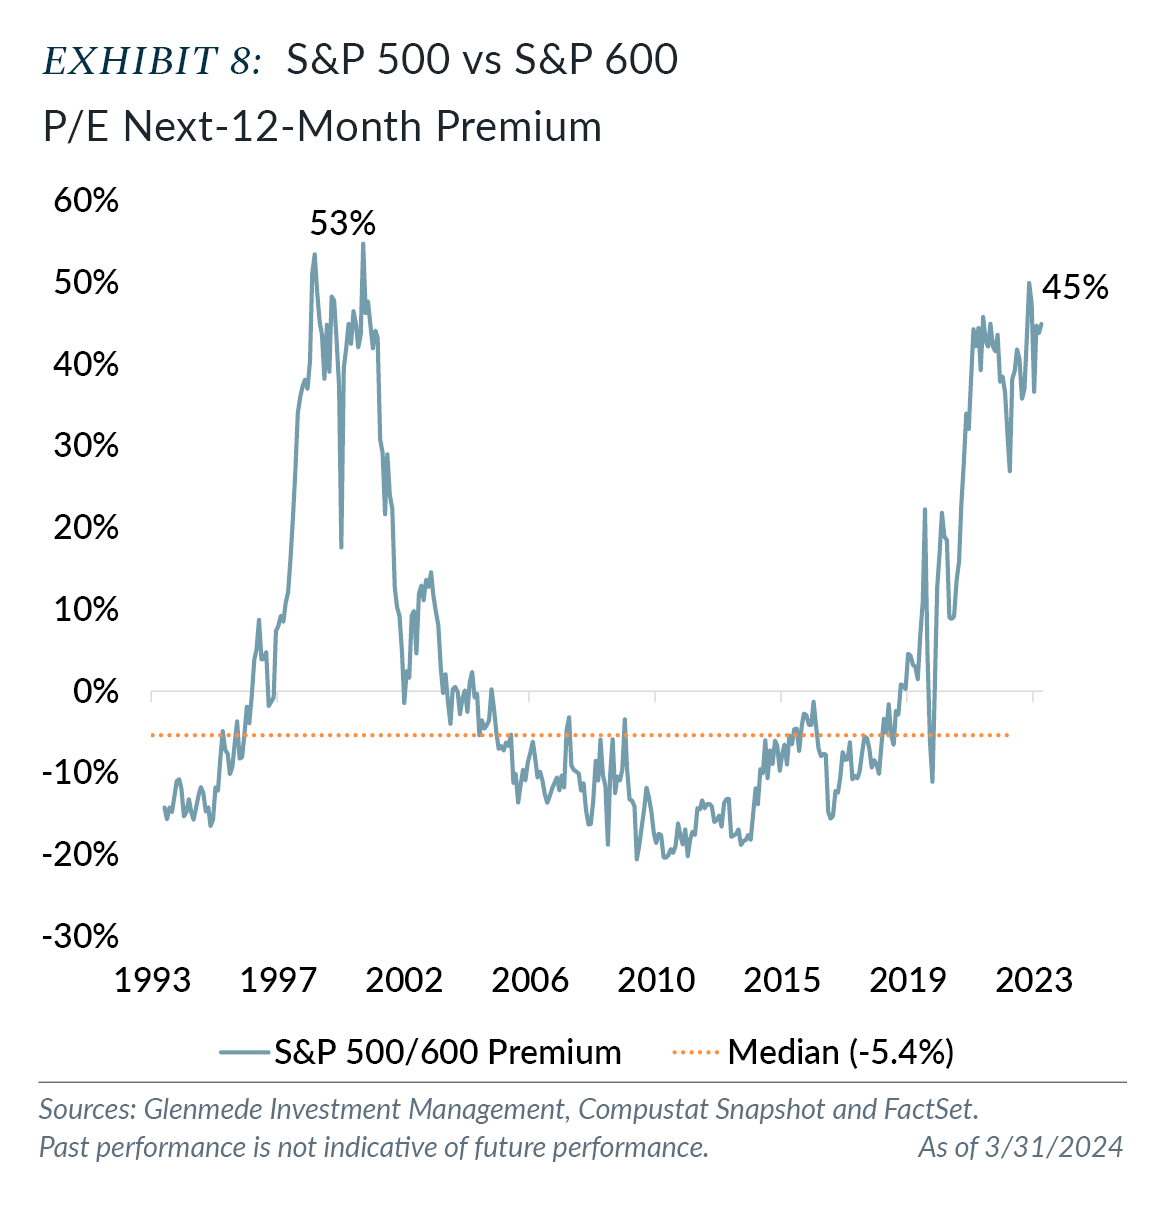
As an alternative small cap index, we consider the S&P SmallCap 600. As noted in our Q3 2023 Quarterly Statement, a study by S&P Dow Jones Indices5 showed that return differences of the Russell 2000 and S&P 600 from December 31, 1993, to July 31, 2019, were primarily in part due to the inclusion of a profitability factor embedded in the S&P 600. For a valuation perspective that reduces the potential valuation impact of negative earners in the Russell 2000, we use the S&P 600. To remain consistent with various index methodologies, we compare the S&P 500 as a proxy for U.S. large cap to the S&P 600 as a proxy for U.S. small cap.
As shown in Exhibit 8, the next twelve month (NTM) P/E multiple of the S&P 500 is trading at a 45% premium to the S&P 600 compared to a -5.4% median relative valuation since 1993. This premium of 45% is in the 96th percentile since 1993 and 98th percentile over the past 20 years.
Specifically, the forward P/E of the S&P 500 is trading at 21.5x versus 14.9x for the S&P 600. The S&P 500 forward P/E ranks in the 81st percentile since 1993 and 92nd percentile over the past 20 years compared to the S&P 600 ranking of 19th percentile and 18th percentile, respectively.
We believe that mean reversion is a starting point to the conversation, but also firmly believe that starting points of valuation matter to future returns. Given the current discount of small cap relative to large in both the Russell and S&P indices, we believe the risk/reward to small cap remains attractive. We continue to prefer strategies that have a higher quality bias with a focus on profitability.
Fun Fact
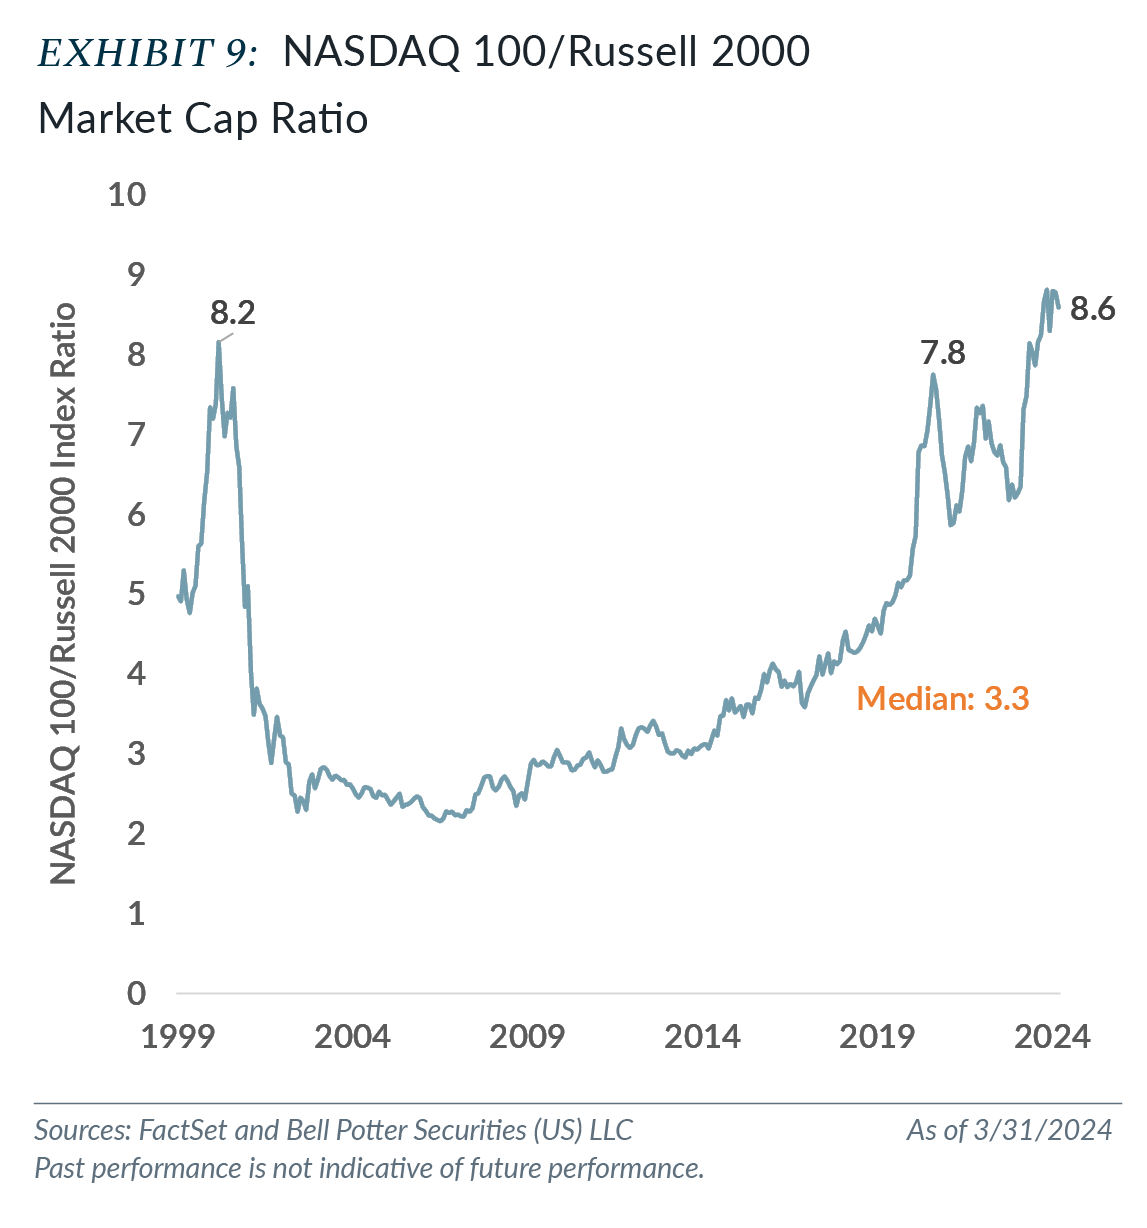
As noted, the broad-based large cap market-cap indices are near historic levels of concentration, with the Information Technology sector a major contributor. But it’s not just broad based large cap indices. In fact, the Nasdaq 100 is the poster child for its exposure to the mega cap growth focused companies.
Our fun fact for the quarter, as shown in Exhibit 9, is that the market cap of the Nasdaq 100 is 8.6x the size of the Russell 2000 market cap. In other words, 100 large cap stocks are 8.6x the size of 2000 small cap stocks. This ratio has surpassed its prior peak of the internet bubble.
Further “fun facting”; if we combine any two stocks that were in the top five weighting of the S&P 500 as of quarter end (Microsoft, Apple, Nvidia, Alphabet, Amazon), these two stocks would have a combined market cap greater than the entire small cap market (Russell 2000). Microsoft’s market cap alone is greater than the market cap of the Russell 2000, and Microsoft and Apple combined are just under twice the market cap of the Russell 2000.
THE QUARTERLY STATEMENT
is a Glenmede Investment Management LP newsletter written in collaboration with the investment teams and Stacey Gilbert, Chief Investment Officer/Portfolio Manager, Derivatives
¹Cumulative return of 38.5% for S&P 500 and -0.4% for Russell 2000 and annualized of 11.5% and -0.1%, respectively.
²Please see our Q2 2023 Quarterly Statement, “Concentration…64…No Repeats…Or Hesitation,” and May 2023 white paper “Concentration Traps of Equity Indexing.”
³The trendline implies equal weighted outperformance by about 2.7% per year, with a strong fit (81.4% R squared).
4We define a negative earner as any company without earnings over the trailing 12 months. For additional reading on negative earners, please see Why Profitability Matters: Positive versus Negative Earners and Negative Earners Could Create Positive Alpha for Active Strategies.
5Brzenk, P., B. Hao, and A. M. Soe. “A Tale of Two Small-Cap Benchmarks: 10 Years Later.” S&P Dow Jones Indices, Sept. 27, 2019, https://www.spglobal.com/en/research-insights/articles/a-tale-of-two-small-cap-benchmarks-10-years-later.
All data is as of 3/31/2024 unless otherwise noted. Opinions represent those of Glenmede Investment Management LP (GIM) as of the date of this report and are for general informational purposes only. This document is intended for sophisticated, institutional investors only and is not intended to predict or guarantee the future performance of any individual security, market sector or the markets generally. GIM’s opinions may change at any time without notice to you. Any opinions, expectations or projections expressed herein are based on information available at the time of publication and may change thereafter, and actual future developments or outcomes (including performance) may differ materially from any opinions, expectations or projections expressed herein due to various risks and uncertainties. Information obtained from third parties, including any source identified herein, is assumed to be reliable, but accuracy cannot be assured. This paper represents the view of its authors as of the date it was produced, and may change without notice. There can be no assurance that the same factors would result in the same decisions being made in the future. In addition, the views are not intended as a recommendation of any security, sector or product. Returns reported represent past performance and are not indicative of future results. All results reported are of unmanaged indices, used just as illustrations for various market segments. These do not reflect what an actual investment in this sector would achieve, as it includes no accounting for trading costs or fees. Performance of any particular investment in one of these market segments could be lower or higher than what is reflected above.